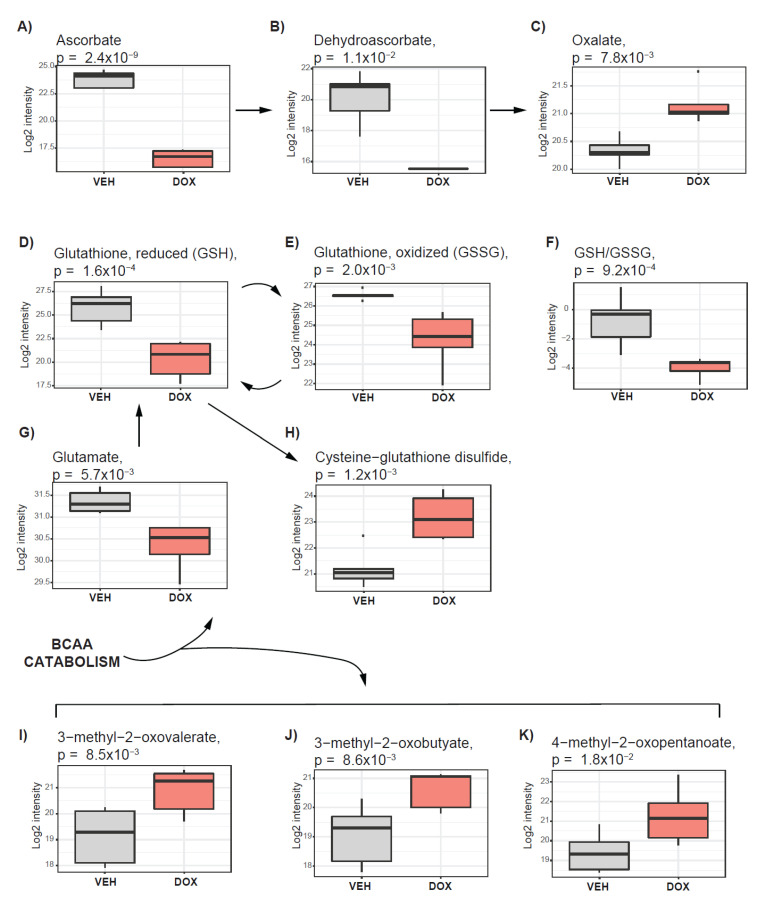
Figure 5.
Activation of pathways supporting tumor antioxidative capacity in response to doxorubicin treatment. The boxplots represent alterations in ascorbate metabolism (A–C); Glutathione metabolism (D,E,G,H); metabolic ratio between reduced and oxidized glutathione (GSH/GSSG) (F); Branch chain amino acid catabolism (I–K). Vehicle−treated cells are depicted in grey, and those treated with doxorubicin are indicated in red.

