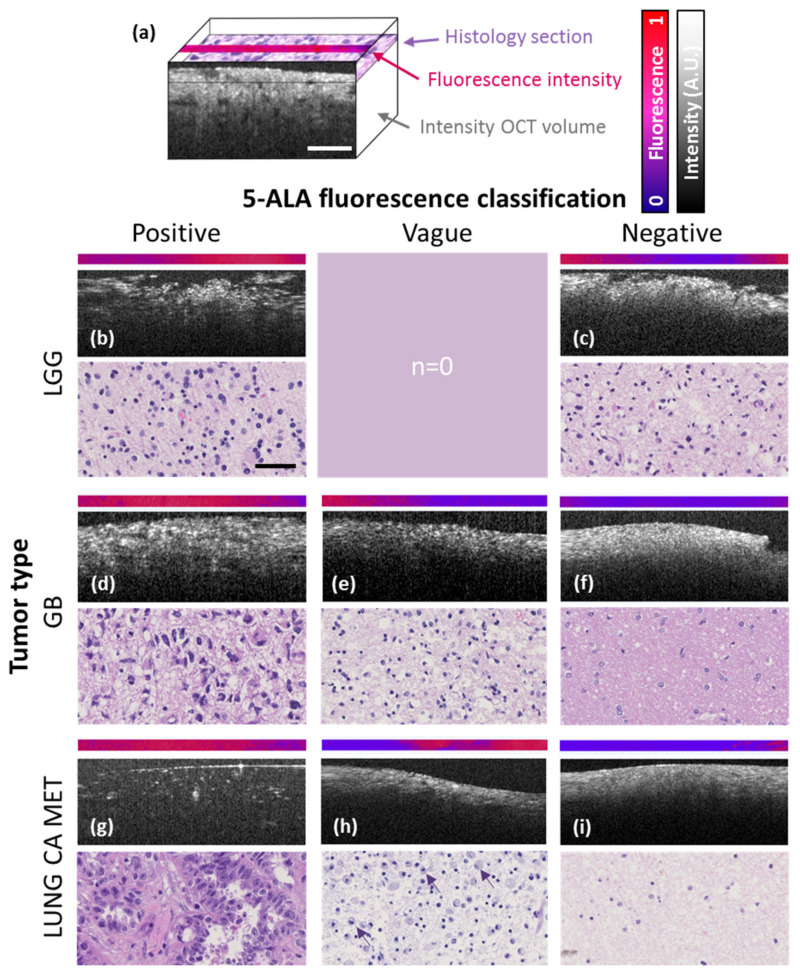
Figure 1.
Cross-sections and digital pathology scans of representative tumor samples for each tumor entity evaluated in the study. Each panel features a 2.5-µm-thick line of the fluorescence micrograph and the corresponding OCM (optical coherence microscopy) B-scan image. Corresponding histological sections are shown below. (a) Schematic 3D representation provides orientation of feature extraction planes. (b,c) LGGs (lower-grade gliomas) with strong (b) and without (c) 5-ALA (5-aminolevulinic acid) fluorescence observed during fluorescence-guided surgery (FGS) respectively. (d–f) GB (glioblastoma) with strong (d), vague (e) and without (f) intraoperative 5-ALA fluorescence respectively. (g–i) Lung CA MET (lung cancer metastasis) with strong (g), vague (h) and without (i) 5-ALA fluorescence observed during FGS. Note, infiltration by macrophages in (h) indicated by purple arrows and necrosis in (i) throughout the tissue. Scale bars correspond to 50 µm.

