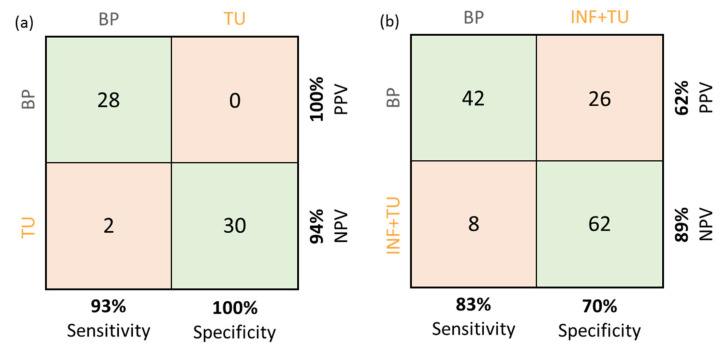
Figure 5.
Contingency tables for both CNNs trained in this study. (a) Contingency table with positive predictive values (PPV) and negative predictive values (NPV) for the network trained on tumor (TU) and non-neoplastic brain parenchyma (BP) tissue B-scans. (b) Contingency table with PPV and NPV for the network trained on both infiltration zone and tumor (INF + TU) as compared to non-neoplastic tissue B-scans.

