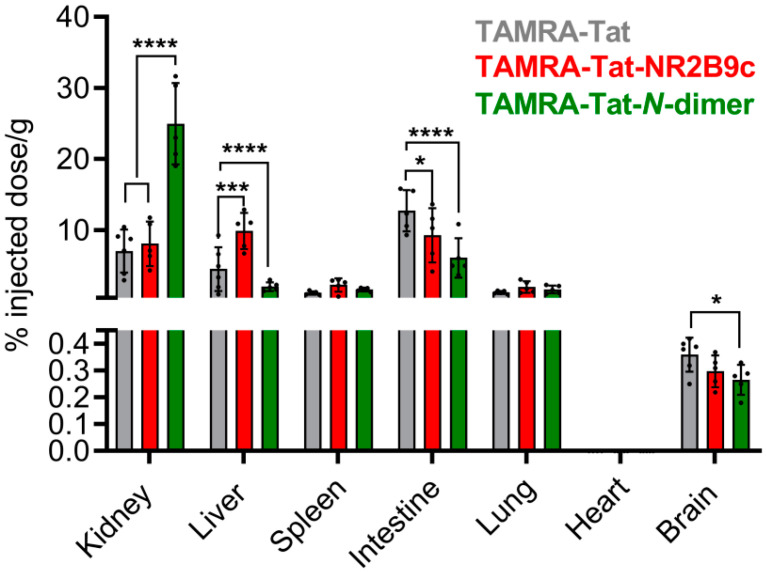
Figure 6.
Biodistribution of TAMRA-Tat, TAMRA-Tat-NR2B9c, and TAMRA-Tat-N-dimer in tissues isolated from NMRI mice following tail vein administration of 3 nmol peptide/g body weight and 1 h of circulation with quantification via TAMRA fluorescence. Data are presented as mean ± SD (N = 4–6). * p < 0.05, *** p < 0.001, **** p < 0.0001 (two-way ANOVA with Tukey’s multiple comparisons test for kidney, liver, spleen, intestine, lung, and heart; unpaired t-test for brain).

