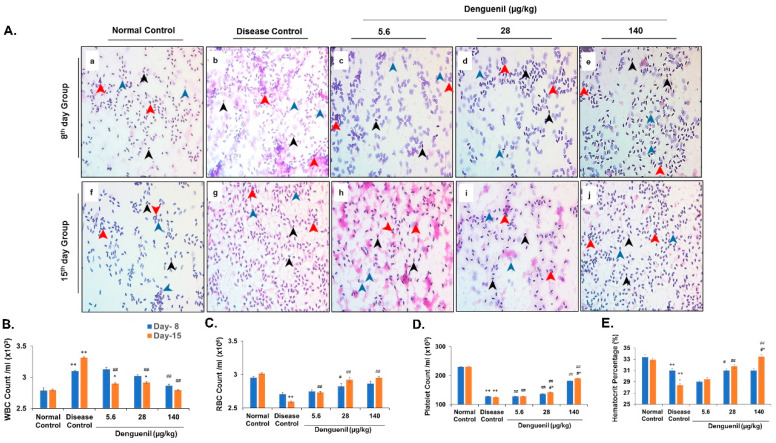
Figure 4.
Pharmacological treatment with Denguenil reverses virus-induced serological dynamics. Whole blood was collected and analyzed using H&E staining of blood smears and differential blood cell counts. (4A) Blood smear analysis. (a, f) Normal Control. (b, g) Disease Control. (c, h) 5.6 μg/kg Denguenil. (d, i) 28 μg/kg Denguenil. (e, j) 140 μg/kg Denguenil. (4B) Whole blood WBC count. (4C) Whole blood RBC count. (4D) Whole blood platelet count. (4E) Hematocrit percentage analysis. Black arrowheads indicate RBC; blue arrowheads indicate WBC, and red arrowhead indicates platelets. n = 24, data are presented as means ± SEM. **, ##, #^ p < 0.001 and *, #, ^ p < 0.05 by one-way ANOVA. **, * Represents significant compared to Normal Control; ##, #Represents significant compared to their respective Disease Controls; #^, ^Represents significant among two time points. Original magnification, 40×.

