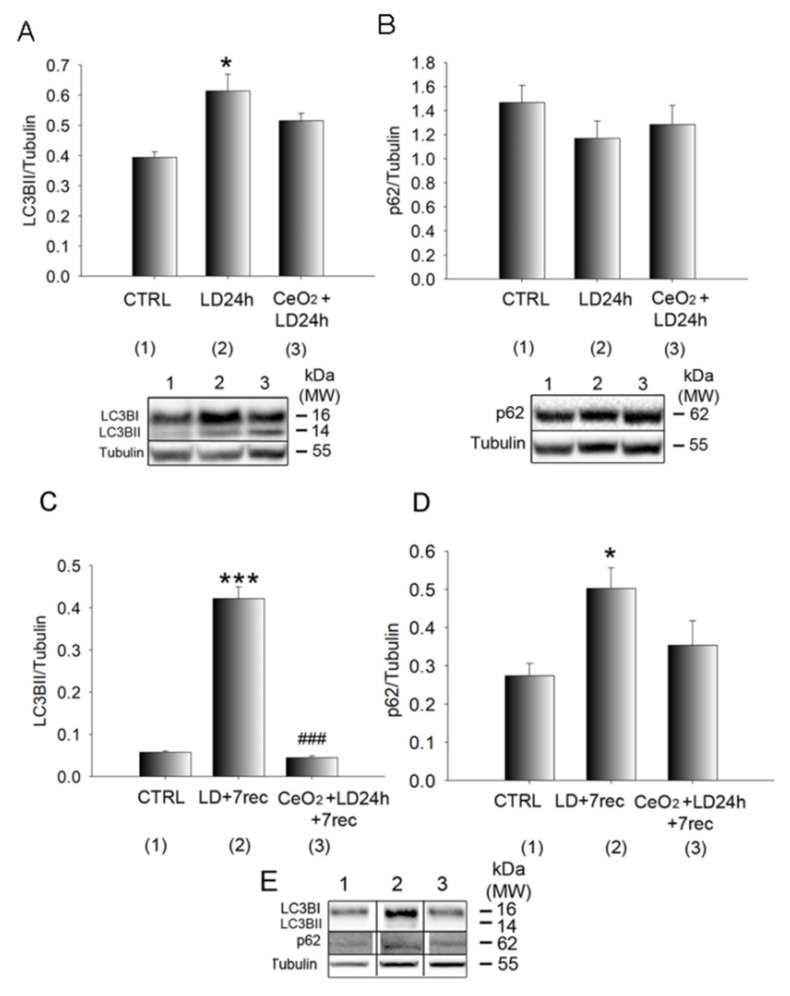
Figure 5.
Quantification of the autophagy markers. (A,B) Western Blot analysis of LC3B-II and p62, respectively, on eye cup samples after 24 h of light exposure. (C,D) Western Blot analysis of LC3B-II and p62, respectively, on eye cup samples 7 days after light exposure. Statistical analysis was performed by a one-way ANOVA test followed by the Tukey test. Data are shown as mean ± SE (n = 4). * p < 0.05, *** p < 0.001 versus control. ### p < 0.001 versus LD. (E) Representative Western blot bands of (C) and (D) panels (1: CTRL, 2: LD + 7 rec, 3: CeO2 + LD + 7 rec). The original Western blots are presented in Figure S4. CTRL: Control. LD24h: animals exposed to light damage (1000 lux) for 24 h. LD24h + 7 rec: animals exposed to LD24h followed by 7 days of recovery. CeO2 + LD24h: animals treated with cerium oxide nanoparticles and then exposed to LD24h. CeO2 + LD24h + 7 rec: animals treated with cerium oxide nanoparticles, then exposed to LD24h and let recover for seven days.

