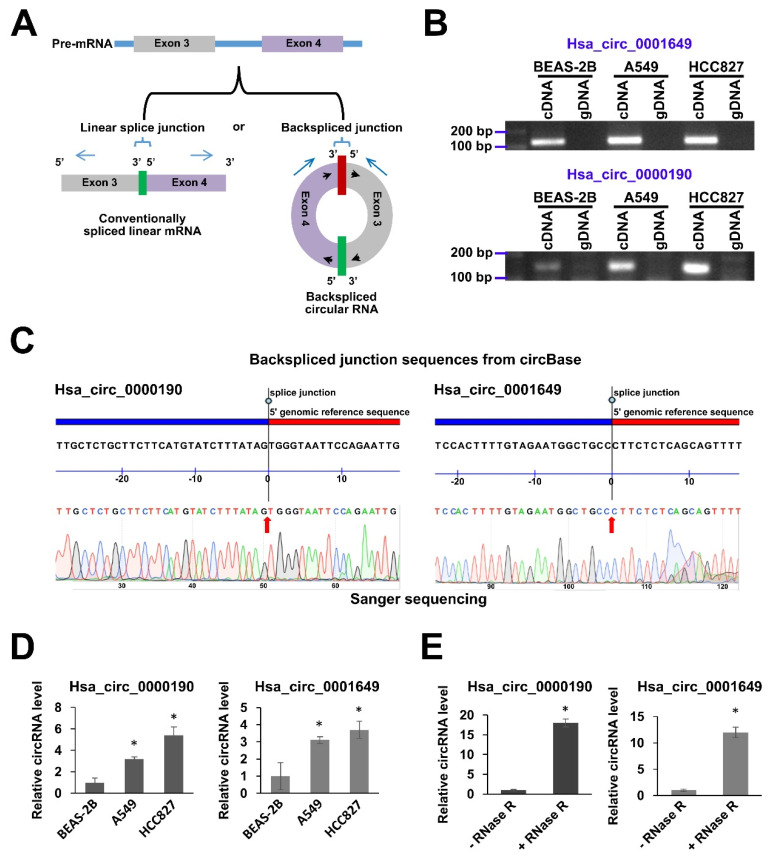
Figure 2.
Validation of expression of hsa_circ_0000190 and hsa_circ_0001649 in LC cell lines. (A) Schematic illustration of a circRNA and its linear form counterpart. The divergent primers (blue arrows) across the backspliced junction can only amplify the circRNA form. (B) Agarose gel electrophoresis analysis of the sizes of RT-PCR amplicons of hsa_circ_0000190 and hsa_circ_0001649 amplified from cDNA templates of the indicated cell lines. gDNA templates were used as a negative control. (C) Sanger sequencing of RT-PCR amplicons of hsa_circ_0000190 and hsa_circ_0001649 (B) aligned to the respective sequences of these circRNAs retrieved from the circBase database. (D) qRT-PCR analysis of expression of hsa_circ_0000190 and hsa_circ_0001649 in BEAS-2B, A549 and HCC827 cell lines. The results expressed as fold change relative to BEAS-2B. (E) qRT-PCR analysis of expression of hsa_circ_0000190 and hsa_circ_0001649 in A549 cells, with or without prior treatment of total RNA with RNase R. The results expressed as fold change relative to—RNase R. In (D) and (E), fold changes were calculated using ddCt method with GAPDH mRNA used as a normalization control. Mean fold changes from three independent experiments are shown with standard deviation error bars. * p < 0.001 (Student’s t-test).

