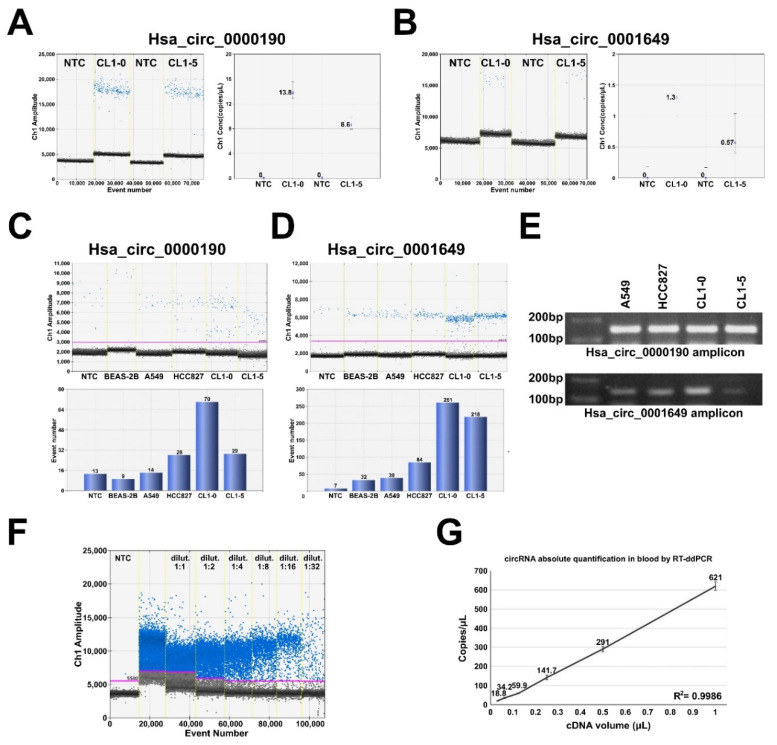
Figure 3.
RT-ddPCR detection of hsa_circ_0000190 and hsa_circ_0001649 secreted by LC cell lines and in human blood plasma. (A,B) ddRT-PCR analysis of the expression of hsa_circ_0000190 (A) and hsa_circ_0001649 (B) in the medium conditioned by CL1-0 and CL1-5 cell lines. Left—amplification plot, right—absolute quantification. NTC—no template control. (C,D) ddRT-PCR analysis of the expression of hsa_circ_0000190 (C) and hsa_circ_0001649 (D) in the medium conditioned by BEAS-2B and the indicated LC cell lines. Top—amplification plot, bottom—quantification. (E) Agarose gel electrophoresis analysis of the sizes of RT-PCR amplicons of hsa_circ_0000190 and hsa_circ_0001649 amplified from cDNA templates of the indicated cell lines. (F,G) ddRT-PCR analysis of the expression of hsa_circ_0000190 in the plasma sample. cDNA was diluted at the indicated ratios, (F)—amplification plot, (G)—absolute quantification.

