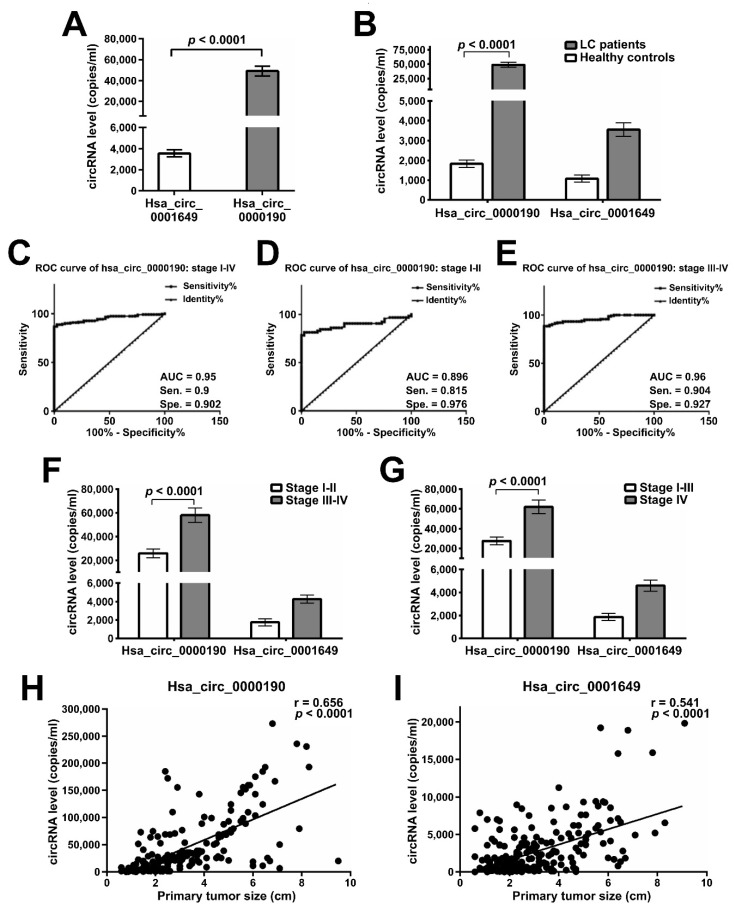
Figure 4.
Expression levels of plasma circRNAs in different stages and tumor sizes of LC. (A) RT-ddPCR analysis of expression of hsa_circ_0000190 and hsa_circ_0001649 in the plasma of lung cancer patients’ blood samples. Mean values are shown with standard deviation error bars, p-value calculated by Student’s t-test. (B) RT-ddPCR analysis of expression of hsa_circ_0000190 and hsa_circ_0001649 in the plasma of lung cancer patients’ and healthy controls’ blood samples. Mean values are shown with standard deviation error bars, p-value calculated by Student’s t-test. (C–E) ROC curve analysis of diagnostic ability of hsa_circ_0000190 to discriminate between healthy individuals and LC patients of all TNM stages (C), stages I-II (D), stages III-IV (E). 2722 copies/mL was used as a cut-off value for hsa_circ_0000190 expression threshold. AUC—area under the curve, Sen.—sensitivity, Spe.—specificity. (F,G) RT-ddPCR analysis comparing the expression of hsa_circ_0000190 and hsa_circ_0001649 in the plasma of lung cancer patients of stages I-II and stages III-IV (F), stages I-III and stage IV (G). Mean values are shown with standard deviation error bars, p-value calculated by Student’s t-test. (H,I) Pearson correlation analysis of expression levels of hsa_circ_0000190 (H) and hsa_circ_0001649 (I) and primary tumor sizes.

