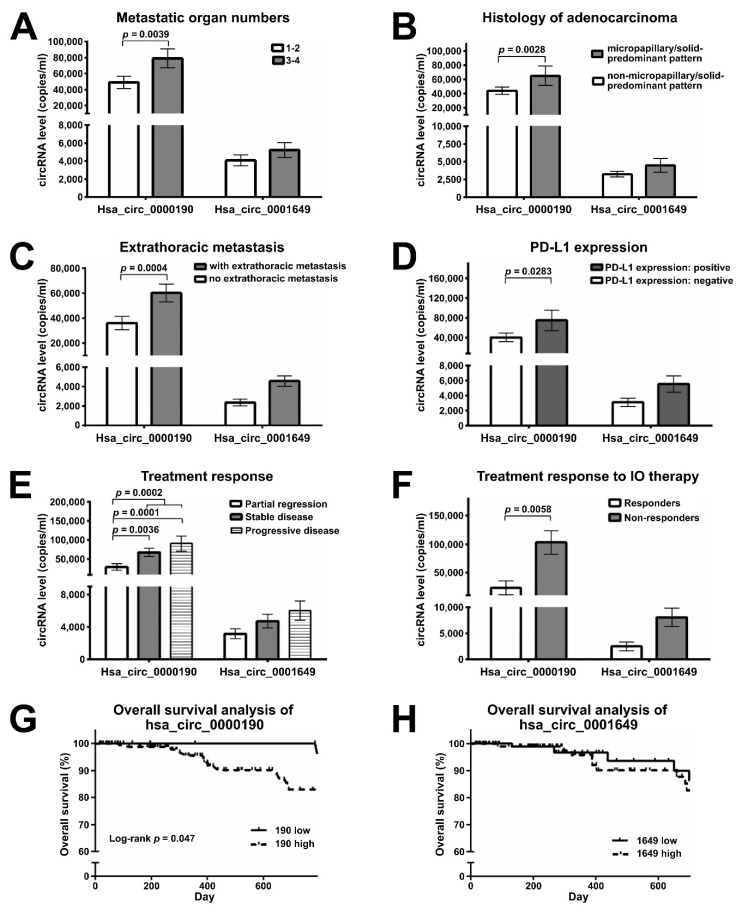
Figure 5.
Plasma levels of hsa_circ_0000190 negatively correlate with the response to immunotherapy. (A–F) RT-ddPCR analysis comparing the expression of hsa_circ_0000190 and hsa_circ_0001649 in the plasma of lung cancer patient groups with: (A) different numbers of metastatic organs (1–2 vs. 3–4 organs); (B) micropapillary/solid-predominant histological type vs. other histological types; (C) with vs. without extrathoracic metastasis; (D) positive vs. negative PD-L1 expression; (E) the indicated types of treatment response; (F) positive vs. negative response to IO therapy. Mean values are shown with standard deviation error bars, p-value calculated by Student’s t-test. (G,H) Survival analysis of patients with high and low expression of hsa_circ_0000190 (G) and hsa_circ_0001649 (H).

