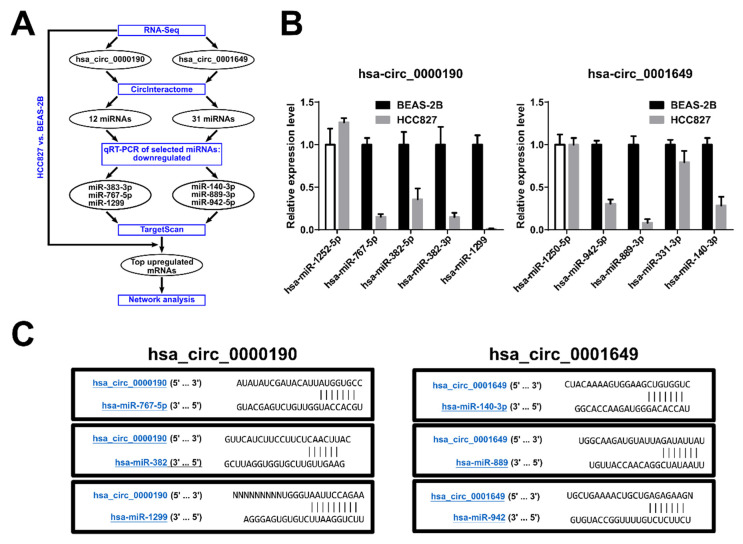
Figure 7.
Bioinformatics analysis of potential downstream network for hsa_circ_0000190 and hsa_circ_0001649 in LC. (A) Pipeline of analysis. (B) qRT-PCR analysis of expression of the selected predicted miRNA targets of hsa_circ_0000190 (left) and hsa_circ_0001649 (right). (C) The predicted interaction sites between hsa_circ_0000190, hsa_circ_0001649 and predicted target miRNAs.

