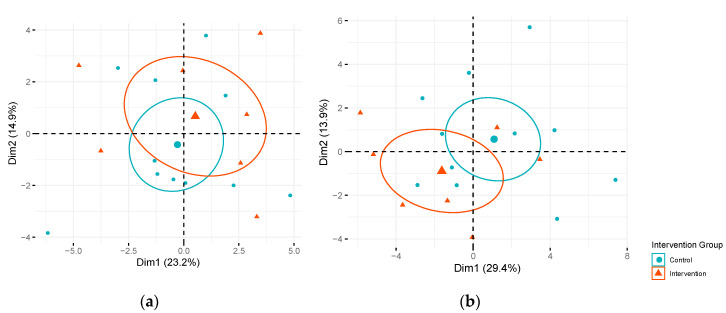
Figure 1.
Score plot of principal component (PC) 1 versus PC2 by intervention arm. Fasting metabolites in intervention and control arms among Pregnancy and EARly Lifestyle improvement Study (PEARLS) participants: (a) during early (n = 29) and (b) mid-pregnancy (n = 18). Dimension 1 (Dim1) represents PC1 and Dimension 2 (Dim2) represents PC2. Percentage of variation in fasting metabolite levels explained by each PC is presented in parentheses. Ellipses represent 95% confidence ellipses by intervention group and larger symbols represent the center of the ellipse.

