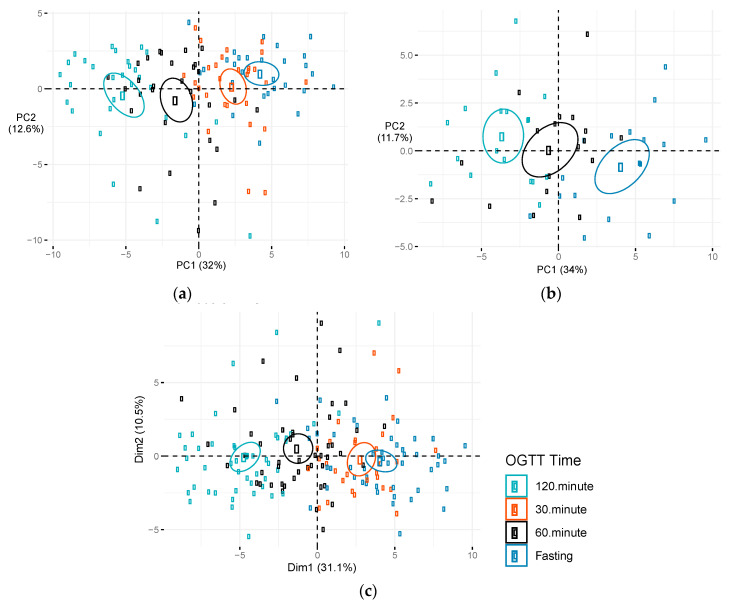
Figure 3.
Score plot of principal component (PC) 1 versus PC2 by OGTT time. Metabolite levels during an OGTT among PEARLS participants: (a) During early pregnancy (n = 29), (b) mid-pregnancy (n = 18), and (c) combination of OGTTs conducted during early and mid-pregnancy. Figures depict plots of first two components. Dim1 represents PC1 and dim2 represents PC2. Percentage of variation in metabolite levels during an OGTT explained by each PC is presented in parentheses. Ellipses represent 95% confidence ellipses by OGTT time. Abbreviations: Dim, dimension; OGTT, oral glucose tolerance test; PC, principal component.

