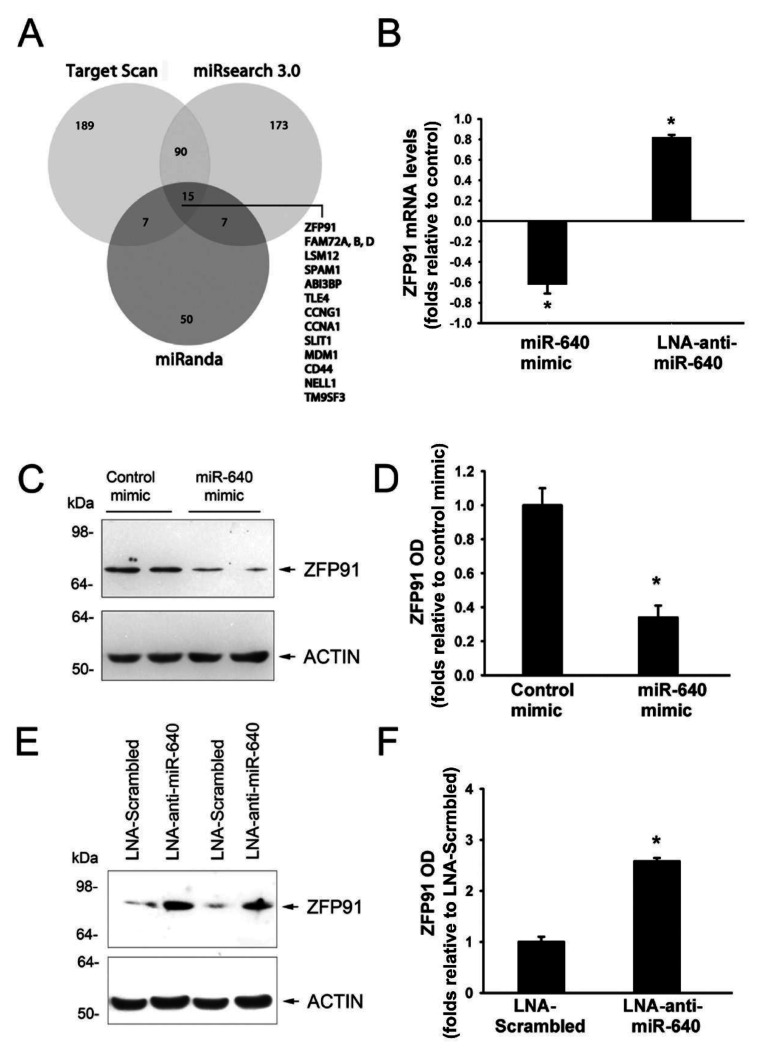
Figure 4.
Identification of miR-640 targets. (A): Venn diagram displaying computationally predicted targets of hsa-miR-640 by TargetScan, miRanda, and miRsearch3.0. Commonly predicted targets by the three algorithms are listed. (B): ZFP91 mRNA expression in HUVECs transfected 48 h earlier with the control mimic, miR-640 mimic, control inhibitor, or miR-640 inhibitor. Values are means ± SEM. * p < 0.05, compared to the corresponding control group (mimic or inhibitor). (C and D): Representative immunoblots and optical densities (OD) of ZFP91 protein in HUVECs transfected 48 h earlier with control or miR-640 mimics. Values are means ± SEM, expressed as folds relative to the control mimic. * p < 0.05, compared to the control mimic. (E and F): Representative immunoblots and optical densities (OD) of the ZFP91 protein in HUVECs transfected 48 h earlier with control or miR-640 inhibitors. Values are means ± SEM and are expressed as folds relative to control inhibitor. * p < 0.05, compared to control inhibitor.

