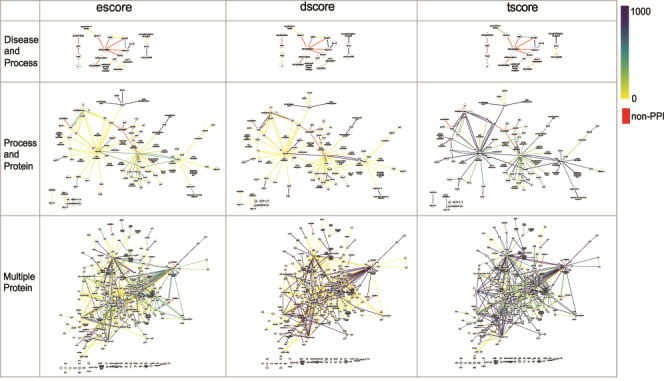
Figure 7.

The networks of selected PPI interactions for the Disease and Process set (top row), Process and Protein set (middle row), and Multiple Protein set (bottom row), where each edge color represents a value of escore (left), dscore (middle) or tscore (right). Each PPI edge is colored by the indicated score type, from the minimum (0) to the maximum score (1000). A red edge indicates a non-PPI.
