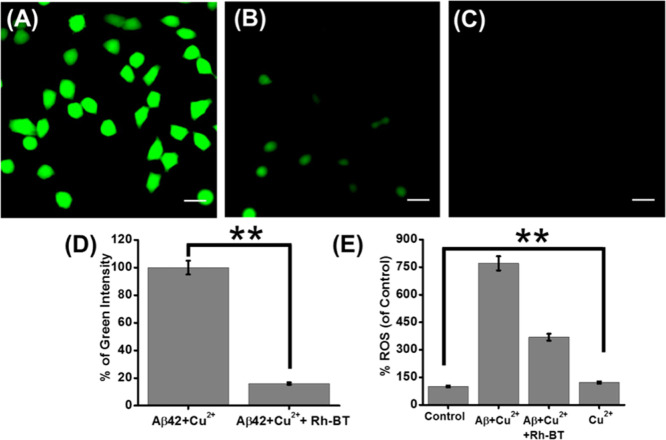
Figure 7.
Live microscopy images of PC12-derived neurons stained with DCFDA. (A) Neurons were treated with Aβ + Cu2+ (1:1). (B) Neurons were treated with Aβ + Cu2+ (1:1) in the presence of Rh-BT. (C) Neurons were treated with only Rh-BT to check the autofluorescence of Rh-BT. Scale bars corresponding to 20 μm. (D) Quantitative analysis of green fluorescence intensity (by ImageJ software). (E) Bar diagram for the DCFDA assay. Error bar corresponds to the SD of the value (**p ≤ 0.05).

