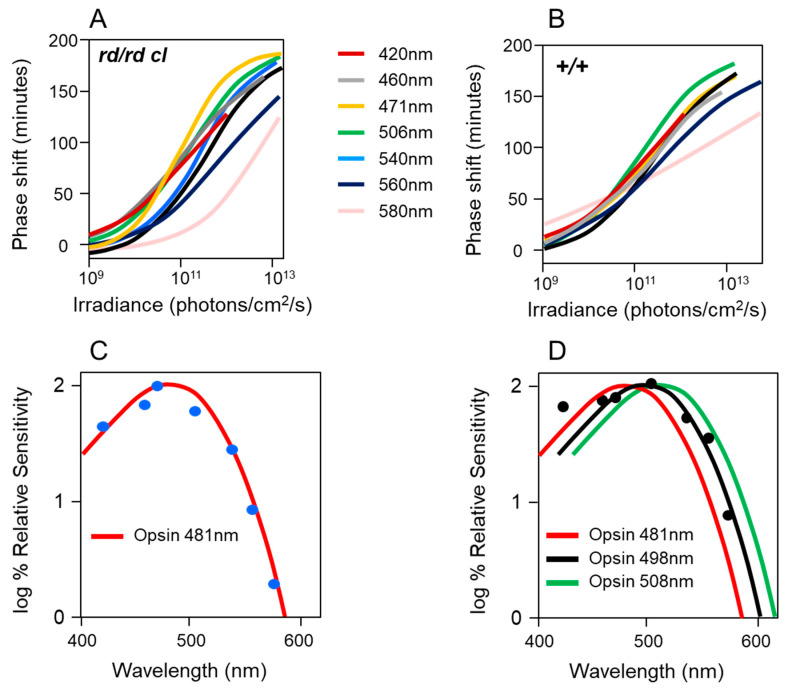
Figure 3.
Action spectra for circadian entrainment. Action spectra were derived using the magnitude of the phase shift in a freerunning locomotor activity rhythm by a 15 min light stimulus. Wheel running activity rhythms of singly housed male C3H/He rd/rd cl and wildtype mice aged between 80 and 250 days were monitored. Animals were entrained to a L:D 12:12 cycle for seven days then placed under constant darkness. After 7 to 10 days of constant darkness, a single monochromatic (half band width = 10nm), 15 min light pulse of defined irradiance was applied four hours after activity onset (Circadian Time 16) to generate maximum phase delays. Animals were returned to constant darkness for a further 10 days. The magnitude of the phase shift was calculated by comparing the time of activity onset before and after the light pulse. Pre-pulse phase was calculated from the seven days prior to the light pulse application, and the post-pulse stable freerunning activity was calculated from the seven days after the light pulse, taken from the second day after the light pulse. Monochromatic and neutral density filters were used to regulate the wavelength and intensity of the stimulus allowing irradiance response curves to be compiled at 420, 460, 471, 506, 540, 560 and 580 nm. Irradiance response curves (IRCs) were compiled at seven wavelengths of near-monochromatic light (n = 4 to 7 animals for each data point) between 420 and 580 nm in: (A) the rd/rd cl and (B) wildtype mice. (C) The derived action spectrum for circadian entrainment in rd/rd cl is well approximated an opsin-retinal photopigment with a novel λmax at 481 nm (R-squared = 0.976). (D) The wildtype action spectrum is also well approximated by an opsin-vitamin A photopigment (R-squared = 0.896), but with a λmax of ~500 nm. This is consistent with the involvement of a rod (498 nm) and/or cone (508 nm) absorption spectra.

