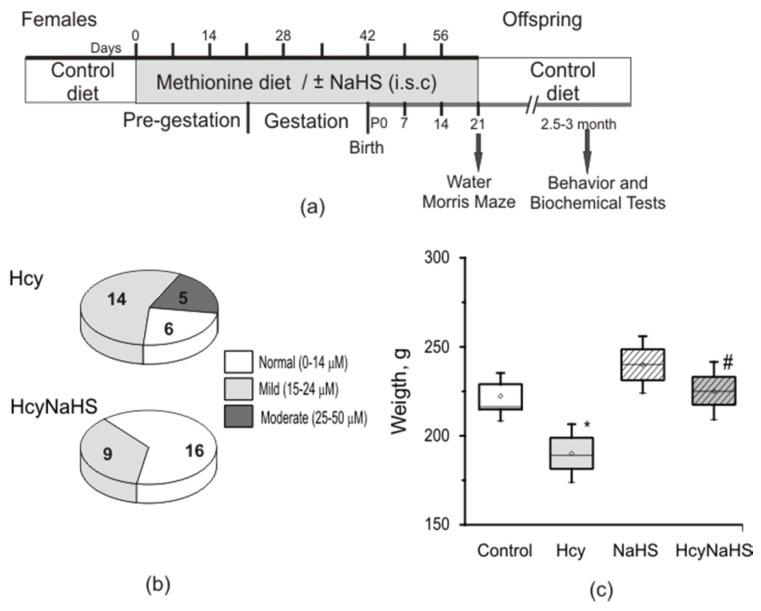
Figure 1.
Experimental design and homocysteine level in rats with maternal hHcy. (a) Schematic representation of the experimental design. (b) Ratio of animals with normal (white sector, 0–14 µM), mild hHcy (grey sector, 15–24 µM), and moderate hHcy (dark grey sector, 25–50 µM) of Hcy and HcyNaHS groups (the number of rats is indicated at the sectors). (c) Average weight of rats from control (white box), NaHS (dashed box), Hcy (grey box), HcyNaHS (grey dashed box) groups. Boxes indicate SEM, horizontal lines—median, the small circle inside boxes—mean value, whiskers—5–95 percentile of data. * p < 0.05 compared to the control group, # p < 0.05 compared to the Hcy group.

