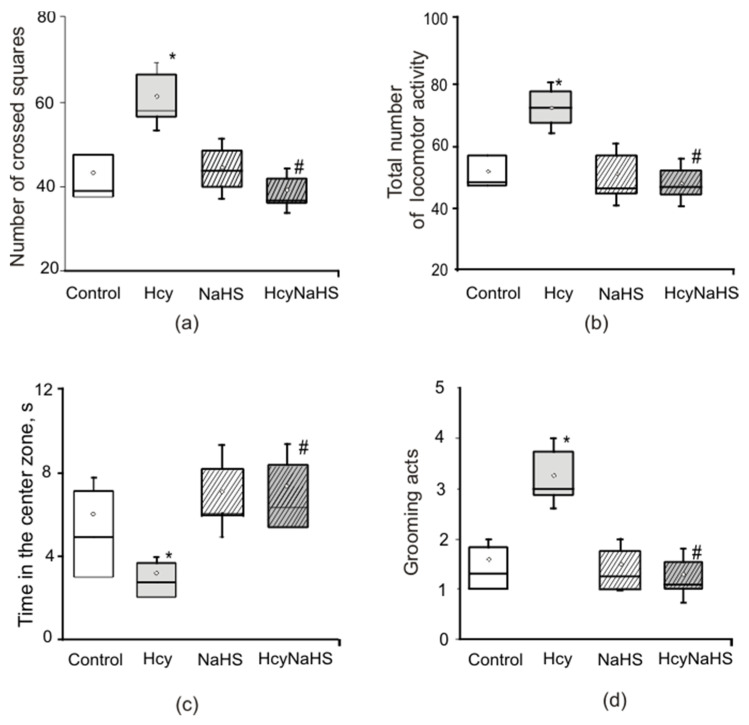
Figure 2.
Effects of maternal hHcy and NaHS treatment on behavior in the open field test. Number of crossed squares (a), total locomotor activity (b), time spent in the central square (c), and grooming (d) of rats compared to control (white boxes), Hcy (grey boxes), NaHS (dashed boxes), HcyNaHS (grey dashed boxes) groups. * p < 0.05 compared to the control group, # p < 0.05 compared to the Hcy group.

