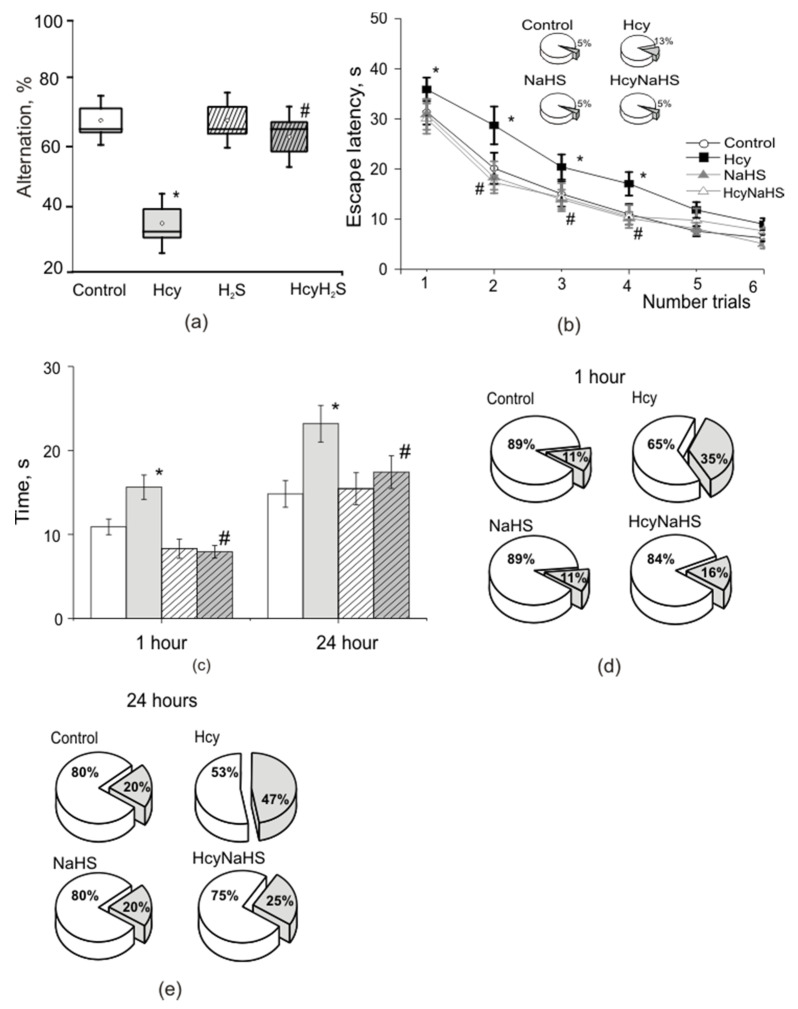
Figure 6.
Effects of maternal hHcy and NaHS treatment on cognitive functions in T maze and Morris test. (a) Percentage of alternation in the T maze of rats from control (white box); Hcy (grey box), NaHS (dashed box), HcyNaHS (grey dashed box) groups. (b) Escape time during learning in the Morris maze of rats in control (white circles), Hcy (grey circles), NaHS (white square), HcyNaHS (grey square) groups. The insert indicates the percentage of rats able of learning (white sector) and failures (grey sector). (с) Time necessary to find the target quadrant in 1 h and 24 h after the training of rats from control (white columns), Hcy (grey columns), NaHS (dashed columns), HcyNaHS (grey dashed columns) groups. Ratio of animals able to remind the platform location (white sectors of the circles) and failures (grey sector) after 1 h (d) and 24 h (e). * p < 0.05 compared to the control group, # p < 0.05 compared to the Hcy group.

