Figure 1.
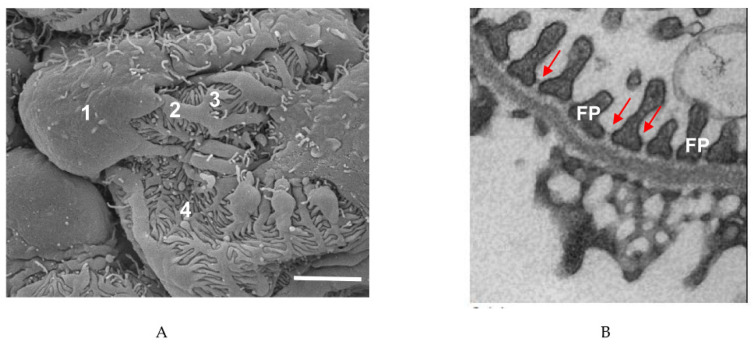
Podocyte structure. (A) Scanning electron microscope image of a podocyte. 1, cell body; 2, major process; 3, secondary process; 4, foot process. Scale bar: 3 µm. (B) Transmission electron microscope image of podocyte foot processes (FPs) and the slit diaphragms between each process (arrows). Scale bar: 1 µm.

