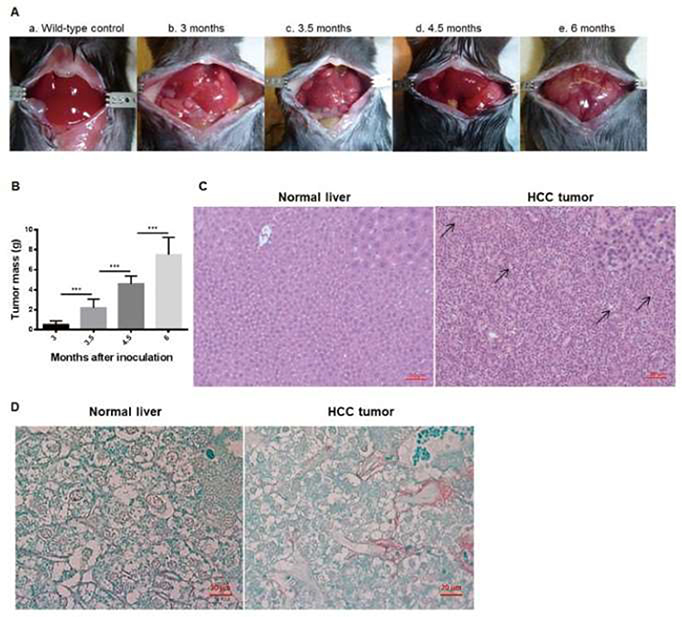
Figure 4: Progressive tumor development in C57BL/6J mice after inoculation with MTD2-hepatocytes.
(A) Hepatocellular carcinoma (HCC) orthotopic tumor model was established according to protocol. Anatomical images were taken before inoculation and at sub-sequential time courses. (a) Shows healthy liver prior to inoculation with MTD2 hepatocytes. (b) Mouse liver 3 months post inoculation with evidence of gross tumor development. (c) 3.5 months after inoculation with increasing tumor burden. (d) 4.5 months after inoculation. (e) 6 months after inoculation with evidence of tumor throughout the liver. (B) Tumor nodules were harvested and weighed at the time points indicated after inoculation with MTD2 hepatocytes. Error bars represent ±SD. ***P < 0.001, statistical analysis was performed by t-tests. (C) Representative images of wildtype and MTD2-inoculated liver sections. Hematoxylin and eosin (H&E) staining depicts pseudogland formation (black arrows). There is nuclear crowding, and tumor cells are eosinophilic with high nucleus-to-cytoplasm ratios (magnified image). Magnification = 20x objective, scale bar = 50 μm. The insets on the upper right are further manually amplified. (D) Sirius red staining indicating abnormal collagen deposition, consistent with liver fibrosis. Magnification: 40x objective, scale bar = 20 μm. Please click here to view a larger version of this figure.

