
Figure 3.
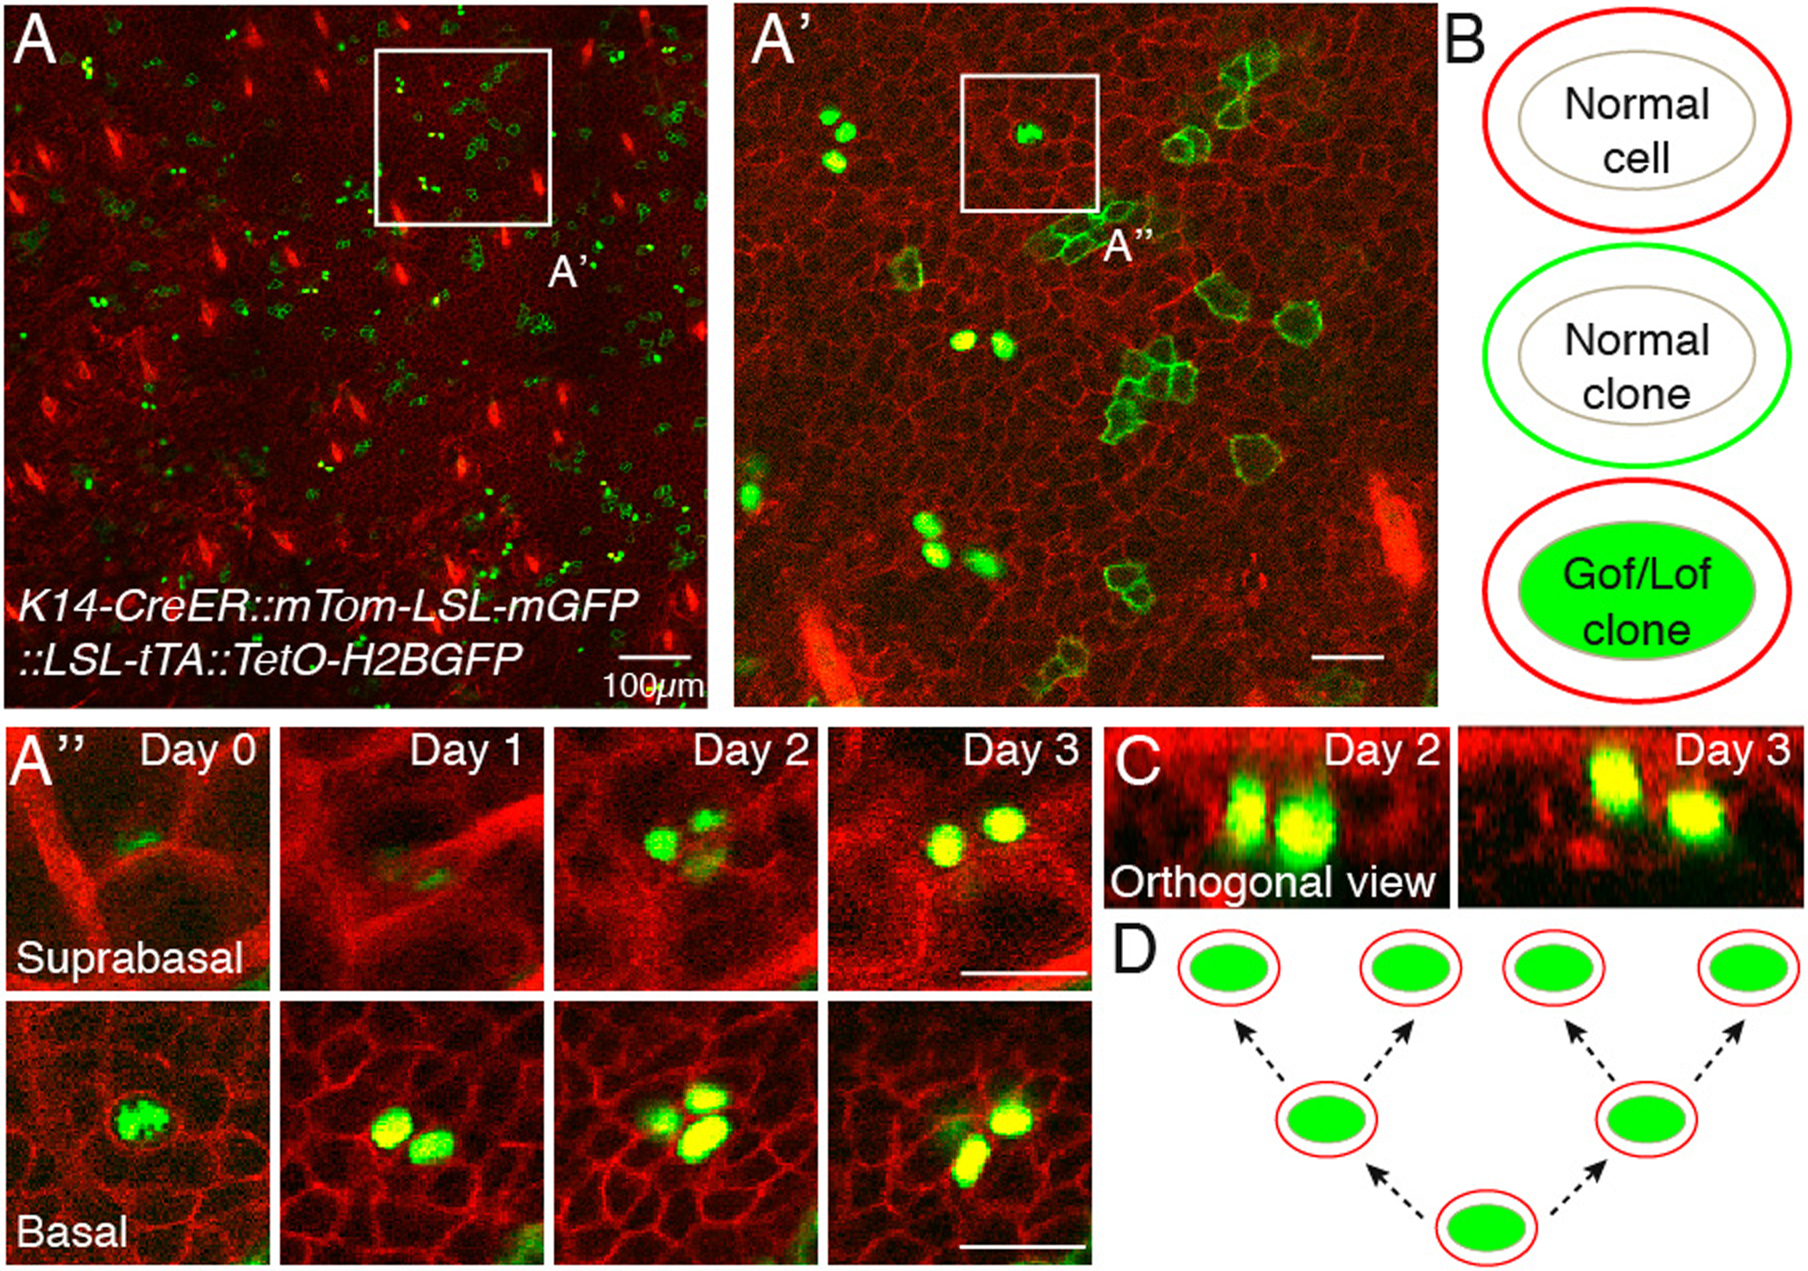
Image analysis. Example data set of a K14-CreER::mTom-LSL-mGFP::LSL-tTA::TetO-H2BGFP mouse acquired daily over 4 days. Overlay of green and red channels of entire imaged region of the skin at Day 0, basal layer is shown (A). Single labeled clones (membrane localized EGFP or nuclear EGFP) are distinguishable within the uniformly fluorescently labeled tissue (membrane tdTomato), with the hair follicle landmarks visible using the latter. Therefore, cells will be either “normal” (red membrane), “normal clones” (green membrane) or genetically modified (green nuclei with red membrane) (B). A region of interest is chosen for in-depth analysis of cell fate (A’). To determine the fate of single labeled clones, basal progenitor cells are looked at individually, along the entire Z stack on Day 0 (A”). For the chosen example, a single basal progenitor gives rise to 4 cells throughout the image period. Two of those can be seen in the suprabasal layer, indicating commitment to differentiation. The upward movement of cells can be more easily visualized by using orthogonal views of the acquired Z stack (C). Overall, in these panels, three division and two differentiation events are documented A possible lineage tree describing the division events (D). An accurate lineage tree cannot be determined with this experimental setup alone, but a label-dilution assay compatible with out system would enable this analysis (see Note 3). Scale bar 25μm unless otherwise indicated.