Figure 1.
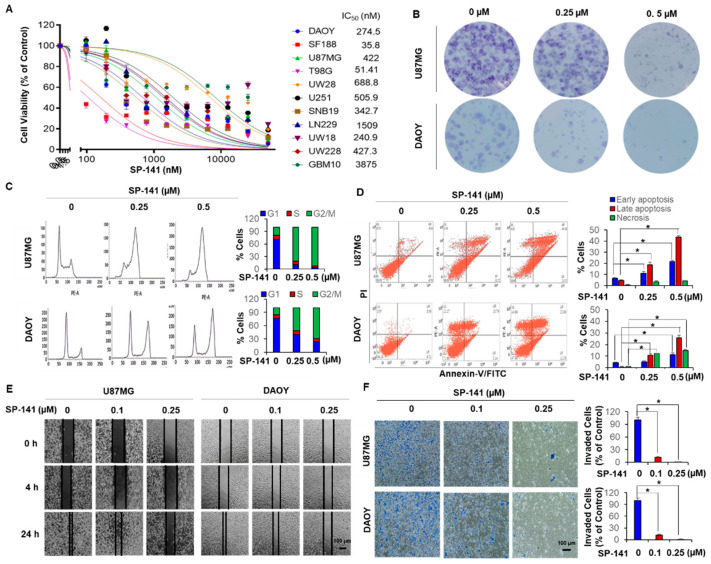
SP-141 shows therapeutic potential in p53 wt and p53 mutant brain tumor cell lines. (A) Cytotoxicity of SP-141 against brain tumor cell lines. Cell growth inhibition was analyzed by the resazurin reduction assay (data represent the results of three independent experiments performed in triplicate). Cells were treated with different dilutions of the compound (0–25 µM) for 72 h. Cytotoxicity (IC50) values in nM are stated for each cell line. (B) Colony formation of two representative cell lines. Cultured DAOY and U87MG cells were treated with SP-141 at different concentrations for 24 h. Twenty-one days after drug removal, cells were fixed and stained with crystal violet and images were prepared. (C) Analysis of cell cycle progression after treatment with different concentrations of SP-141 for 24 h. (D) Apoptosis analysis by flow cytometry using the Annexin V-FITC/PI stain assay. U87MG and DAOY cells were incubated with various concentrations of SP-141 for 24 h then were stained with membrane phosphatidylserine-binding Annexin V-FITC and propidium iodide (PI) (panels Lower Left: FITC Annexin V- and PI- negative; Lower Right: Annexin V-FITC positive; Upper Right: FITC Annexin V- and PI-positive; Upper Left: PI-positive) (* p < 0.01). (E) Cell migration. U87MG and DAOY cells were grown to confluence in six-well plates and a scratch was made at the start of the experiment. The cells were then exposed to SP-141 at the concentrations shown. The wells were imaged at different time points. Scale bars: 100 µm. (F) U87MG and DAOY cells were subjected to a Transwell invasion assay 12 h after treatment with SP-141 (0, 0.1, and 0.25 µM) as specified. The crystal violet dye staining images of lower chambers with migrated cells are shown (* p < 0.01). Scale bars: 100 µm.

