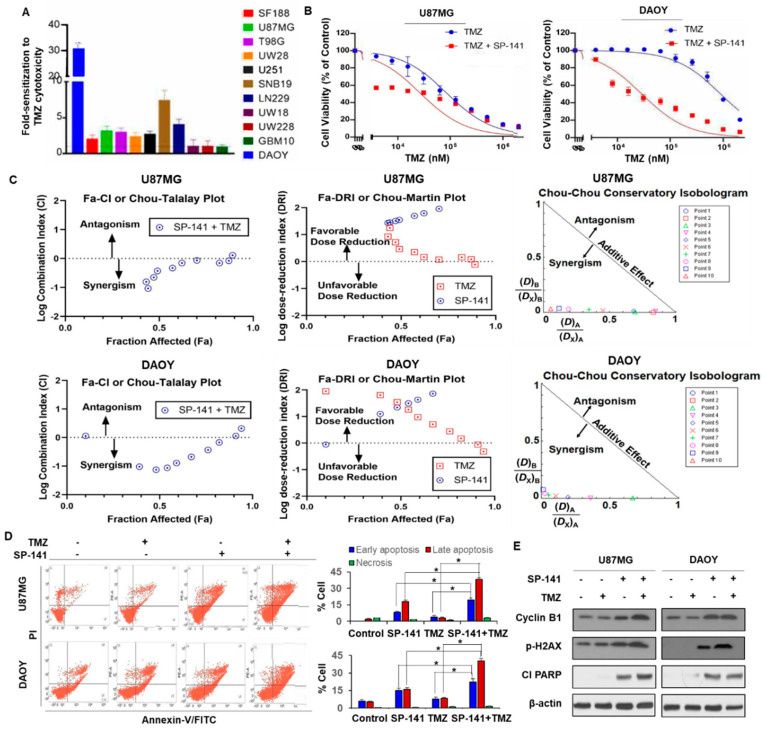
Figure 5.
SP-141 sensitizes brain tumor cells to temozolomide treatment. (A) Bar graph showing the potentiation of TMZ cytotoxicity by SP-141 in a panel of 11 glioblastoma and medulloblastoma cell lines. The tumor cells were simultaneously exposed to SP-141 (at their respective IC20 values) and varying concentrations of TMZ (3 µM to 2 mM). The mean IC50 values of TMZ alone and those of the TMZ + SP-141 combinations were calculated in four independent cytotoxicity assays, each run in triplicate. The average fold-increase in cell killing (± SEM) for the TMZ + SP-141 combination was calculated and is represented in the bar graphs. (B) Potentiation of TMZ cytotoxicity by SP-141. The cytotoxicity of TMZ alone and in combination with SP-141 (at its IC20 concentration) against U87MG and DAOY brain tumor cells is shown. (C) Analyses of synergism in the cytotoxicity of the SP-141 + TMZ combination in DAOY and U87MG cells as determined by the CompuSyn software. The combination index (CI, Chou–Talalay plots) and dose-reduction index (DRI, Chou–Martin Plots) were generated according to the levels of growth inhibition (fraction affected, FA) by each drug used individually and in combination. The normalized isobologram showed that all 10 combination data points were located in the lower left, indicating synergism. The combination index (CI) = (D)A/(Dx)A + (D)B/(Dx)B where (D)A and (D)B were the concentrations of each drug alone required to exert x% effect, while (Dx)A and (Dx)B were the concentrations of drugs in combination to elicit the same effect. (D) Representative Annexin-V-FITC staining of DAOY and U87MG cells treated with 0.25 µM SP-141 and 60 µM TMZ, alone and in combination for 24 h. The mean percentage of cells in early and late apoptotic stages from four experiments of Annexin-V staining are shown in the bar graph. The differences in the early and late apoptotic populations in the cells treated with TMZ + SP-141 compared with TMZ alone or SP-141 alone were statistically significant (* p < 0.01). (E) The cells were treated with SP-141 and TMZ for 24 h prior to analyses of the protein expression.

