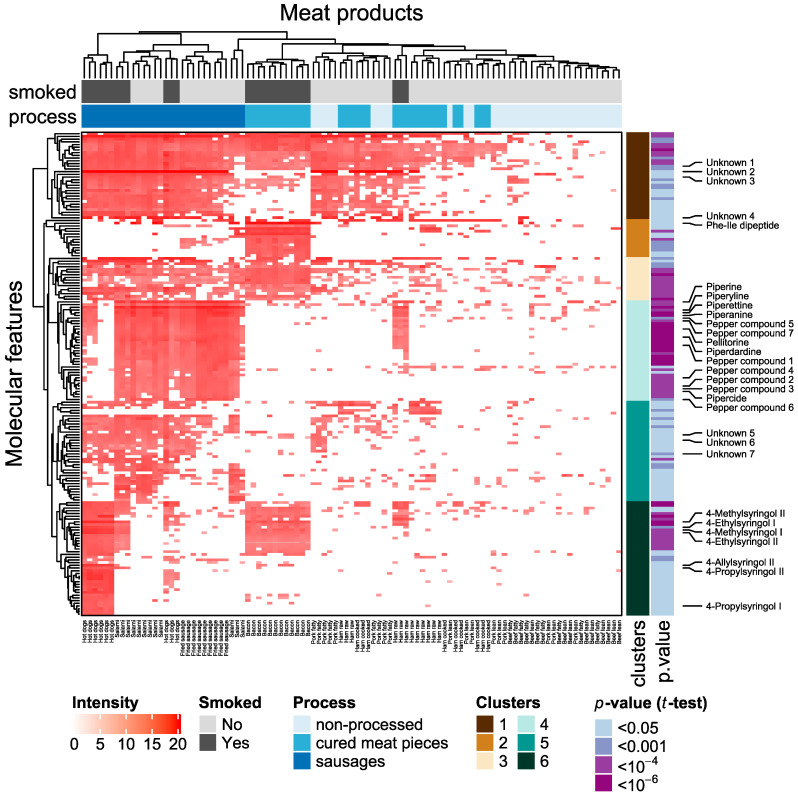
Figure 2.
Heat map showing intensities of metabolite features with significantly higher levels in processed meat digests compared to non-processed meat digests. A Welch’s t-test revealed 178 metabolite features with intensities significantly (FDR-adjusted p-value < 0.05) and increased at least twofold in processed meat products (n = 63) compared to non-processed red meat (n = 36). Intensities were log transformed. Meat products are displayed in columns and colored by the product type. Metabolite features (rows) are colored by the FDR-adjusted p-value of the t-test. Names of identified metabolites are indicated. Details on these compounds with clusters they belong to are given in Table 2 and Supplementary Materials Table S2.

