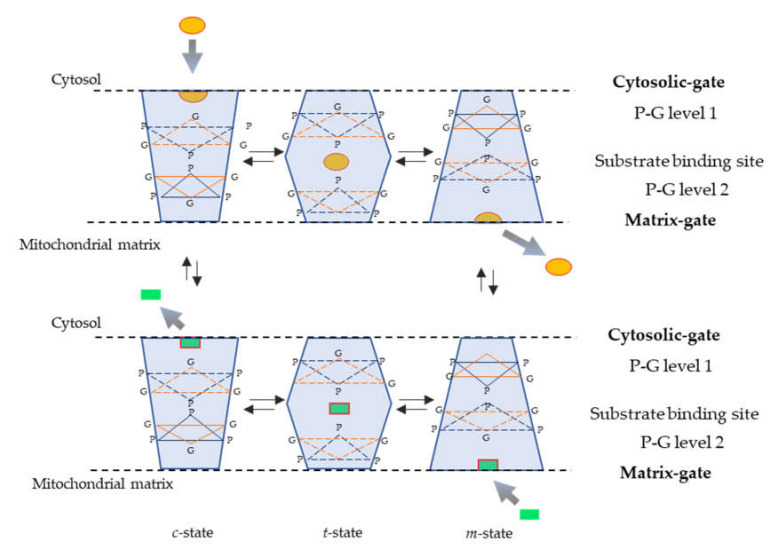
Figure 1.
Mechanism of substrate translocation catalyzed by mitochondrial carriers. Simplified scheme depicting the transition of mitochondrial carriers from the c-state to the m-state and vice versa as previously proposed [14]. The trapezoid shape on the left is used to illustrate the c-state after the release of the substrate towards the cytosol and immediately after the entry of the substrate from the cytosolic side; the trapezoid shape on the right illustrates the m-state after the release of the substrate into the matrix and immediately after the entry of the substrate from the matrix side; and the two central hexagonal shape solids depict the transition states (t-state) of the carrier with the bound substrate entered from the cytosol and from the matrix. The yellow disk and green rectangle shapes represent the substrates entering from the cytosol and from the matrix, respectively; orange triangles represent closed gates, and dotted orange triangles indicate open or partially closed gates. All transport steps are fully reversible. The positions of the salt bridge networks (cytosolic and matrix gates), P-G level 1, substrate binding site and P-G level 2 are indicated on the right.

