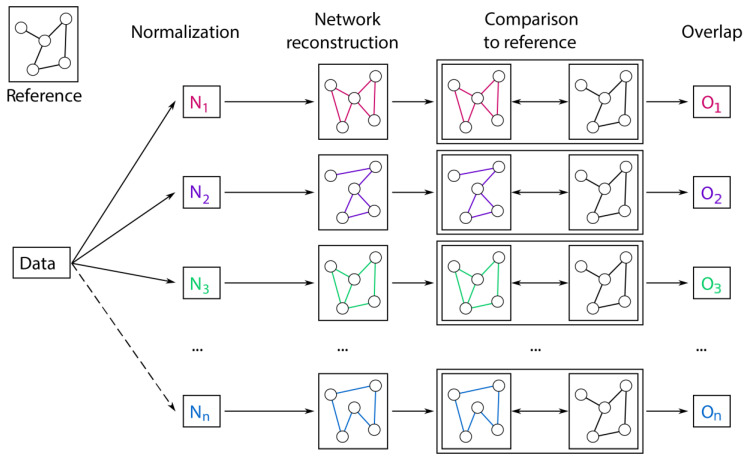
Figure 1.
Pipeline for the evaluation of different normalization methods for glycomics data. First, data are normalized with various approaches. From each processed dataset, a Gaussian Graphical Model (GGM) is inferred and compared to the known biochemical pathway of glycan synthesis. The result of this comparison is a quantitative overlap value that describes how well the estimated GGM represents known synthesis reactions. This overlap is then used to evaluate the normalization approach, where higher overlap corresponds to a better data normalization.

