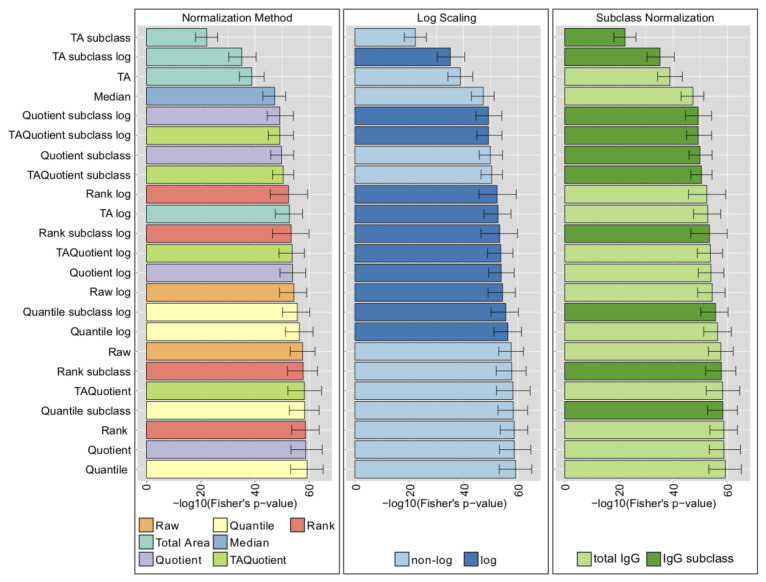
Figure 3.
LC-ESI-MS normalization analysis results (Korčula 2013 cohort). Results in the panels are colored according to type of normalization (left), log-transformation (center), or normalization per IgG subclass or total IgG (right). Bars represent the median of the Fisher’s exact test p-values over 1000 bootstrap samples, and error bars indicate the corresponding 95% confidence intervals.

