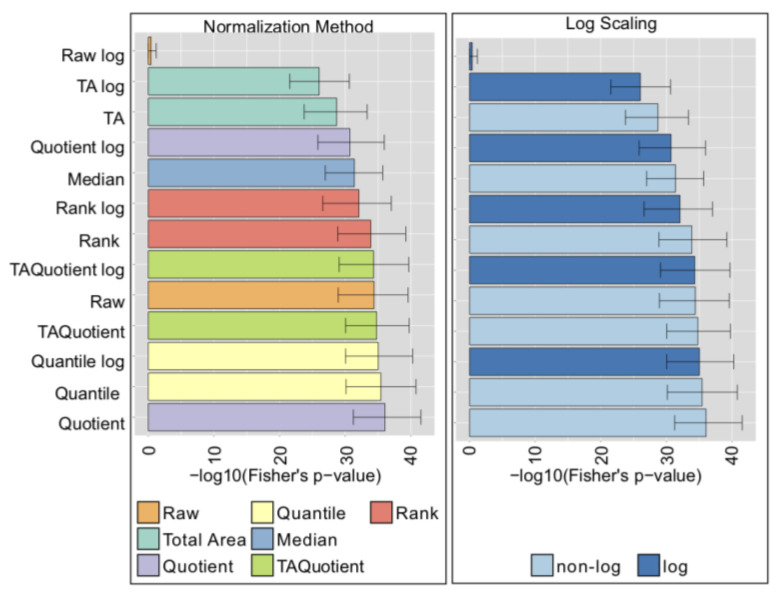
Figure 5.
Matrix Assisted Laser Desorption Ionization-Furier Transform Ion Cyclotron Resonance (MALDI-FTICR-MS) normalization analysis results (Leiden Longevity Study cohort). Results in the panels are colored according to type of normalization (left), or log-transformation (right). Bars represent the median of the Fisher’s exact test p-values over 1000 bootstrapping, and error bars indicate the corresponding 95% confidence intervals.

