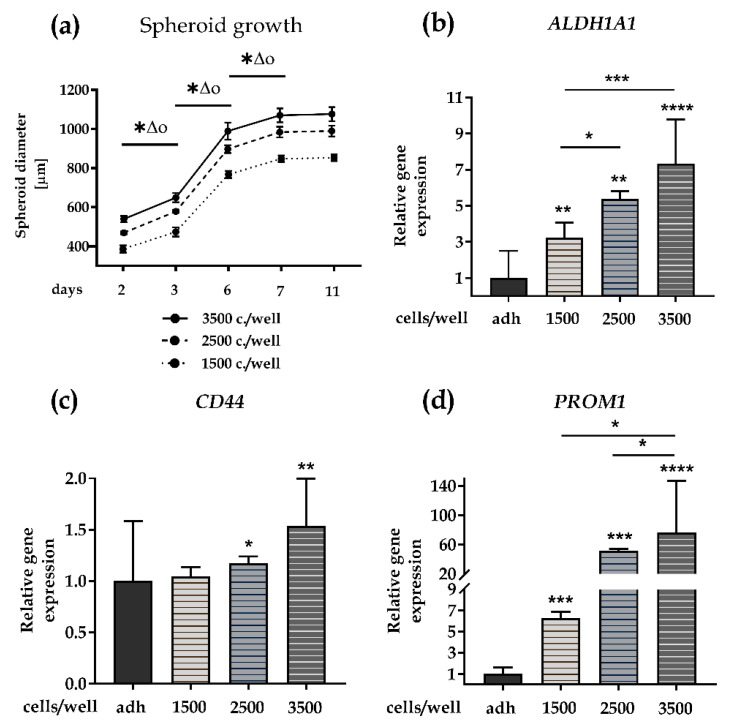
Figure 1.
Stem cell-enriched spheroid model (SCESM) spheroid growth condition analysis. Growth of SCESM spheroids with three different cell seeding concentrations, i.e., 3500, 2500, and 1500 cells per well, was analyzed and relative gene expression of head and neck squamous cell carcinoma (HNSCC) stem markers was assessed; (a) Growth curve of SCESM spheroids cultured for 11 days. Mean values ± SE (n = 4) are presented, (*, ∆, and o represent p < 0.05, * is used for comparisons in group 1500 c./well, ∆ is used for comparisons in group 2500 c./well, o is used for comparisons in group 3500 c./well); (b–d) Relative gene expression of stem markers in 7-day-old SCESM spheroids and an adherent cell line. Normalized mean values ± SE (n ≥ 4) are presented. Asterisks above the graph bars represent the results of statistical analysis of the studied group vs. the control group—adh (* p < 0.05, ** p < 0.01, *** p < 0.001, **** p < 0.0001); (b) Relative gene expression of ALDH1A1; (c) Relative gene expression of CD44; (d) Relative gene expression of PROM1. adh, adherent cell line.

