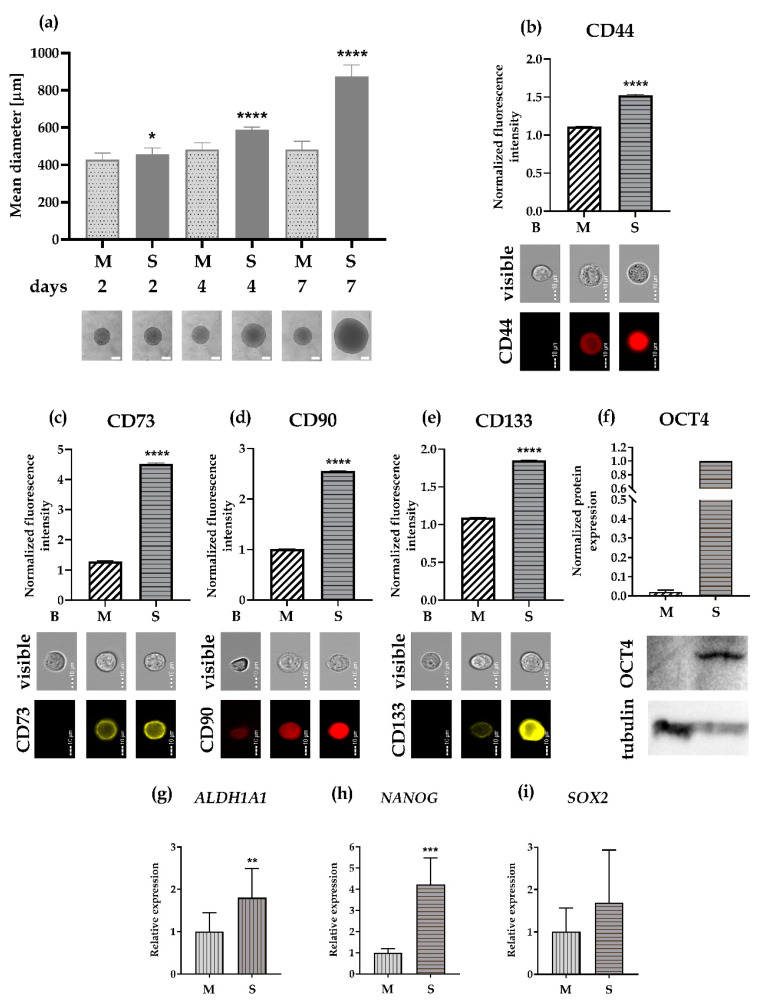
Figure 5.
Comparative analysis of SCESM spheroids and multi-cellular tumor spheroids (MCTSs). (a) Graph representing SCESM spheroid and MCTS mean diameter increase. Spheroids were photographed on days 2, 4, and 7 and representative phase-contrast microscope images of SCESM spheroids and MCTSs on days 2, 4, and 7 are displayed under the graph. Mean values ± SE (n ≥ 8) are presented. Scale bars correspond to 400 µm; (b–e) Protein expression of four different stem markers was assessed in SCESM spheroids and MCTSs by flow cytometry. Normalized fluorescence intensities of selected proteins are presented and corresponding flow cytometry visible light and fluorescent photos are attached (n ≥ 5, N ≥ 2000); (b) CD44 protein expression; (c) CD73 protein expression; (d) CD90 protein expression; (e) CD133 protein expression; (f) OCT4 and tubulin protein expressions were assessed in SCESM spheroids and MCTSs by Western blot analysis. Western blot membrane photo showing OCT4 and tubulin and graph depicting normalized OCT4 protein expression analysis from Western blots (using Image Lab software) are presented (n ≥ 3); (g–i) Relative gene expression of three additional stem markers assessed in 7-day-old MCTSs and SCESM spheroids; Normalized mean values ± SE (n ≥ 5) are presented; (g) Relative gene expression of ALDH1A1; (h) Relative gene expression of NANOG; (i) Relative gene expression of SOX2. (* p < 0.05, **** p < 0.0001 vs. control (MCTS)). B: blank; M: multi-cellular tumor spheroid; S: SCESM.

