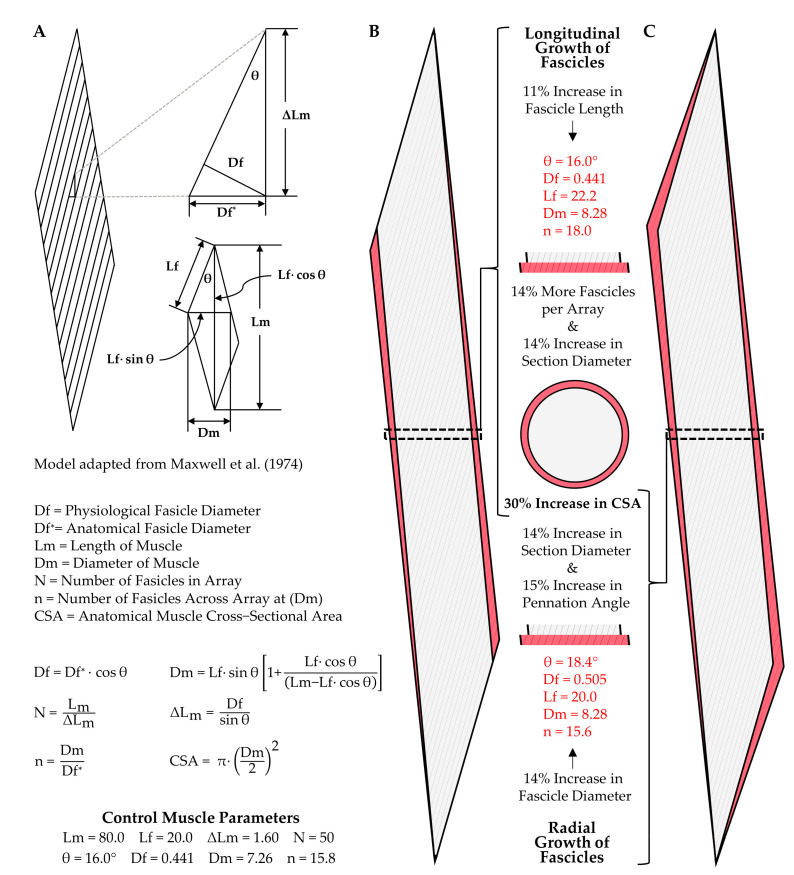
Figure 3.
Illustration of how the longitudinal and radial growth of fascicles can lead to changes in muscle cross-sectional area (CSA). (A) Key elements of a geometric model that can be used to predict the architectural properties of skeletal muscle [75]. (B) Illustration of how an 11% increase in fascicle length would result in 30% increase in CSA, as well as a 30% increase in the number of fascicles per cross-section. (C) Illustration of how a 14% in fascicle diameter would lead to a 15% increase in the pennation angle and a 30% increase in the CSA, but essentially no change in the number of fascicles per cross-section.

