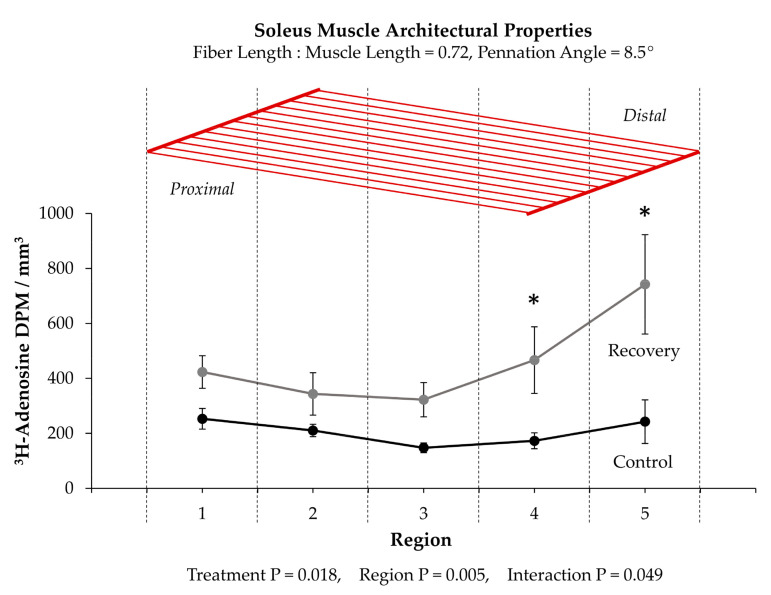
Figure 5.
(Top) Schematic illustration of the soleus muscle and its basic architectural properties [142]. (Bottom) Summary of the data provided by Williams and Goldspink (1973) [135]. Values are presented as the means ± SEM and were analyzed with 2-way repeated measures ANOVA. p-values for the main effects (i.e., Treatment and Region) and interaction are provided. * Significantly different from the region-matched control condition.

