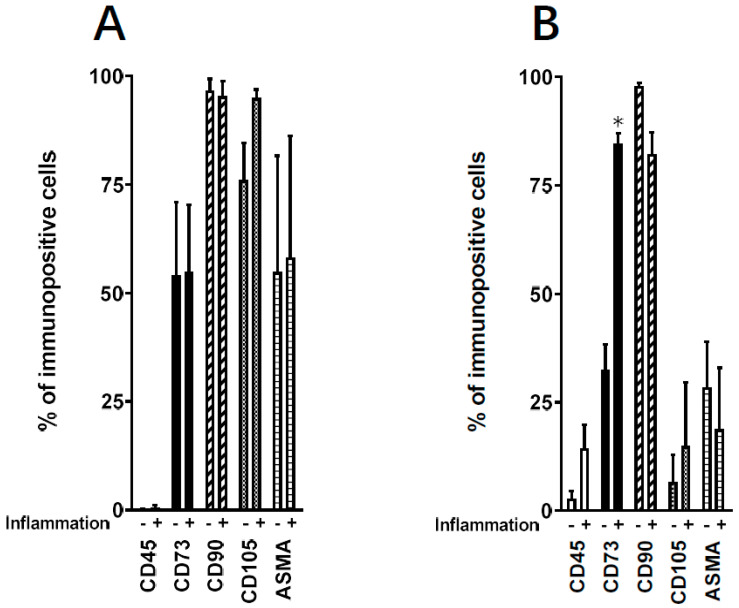
Figure 3.
Effect of inflammation on ADHLSC mesenchymal expression profile. Positive expression of mesenchymal cell surface (CD105, CD90, and CD73) and intracellular markers (alpha-smooth muscle actin—ASMA) was evaluated using validated corresponding primary antibodies and flow cytometry. Negative expression of CD45 was also analyzed. (A) No changes in the mesenchymal expression profile were noticed after 24 h treatment. (B) After 9 days post-treatment with the inflammation cocktail, a significant increase was only observed for CD73 expression. Results are expressed as mean ± standard error of the mean (SEM) (n = 3 samples from different donors). * denotes a p value p < 0.05 vs. corresponding control, paired Student’s t-test.

