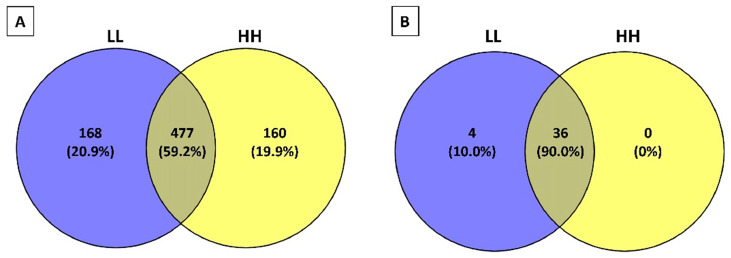
Figure 2.
Venn diagrams of peptides obtained from Parmigiano-Reggiano (PR) peptide fractions. (A) Venn diagram created with all the identified peptides in the 12 PR peptide fractions (see online supplementary material Table S1 for the peptide sequences). (B) Venn diagram created with bioactive peptides identified in the 12 PR peptide fractions (see Table 1 for the peptide sequences). HH represents the samples belonging to the high-salt and high-fat group. LL represents the samples belonging to the low-salt and low-fat group.

