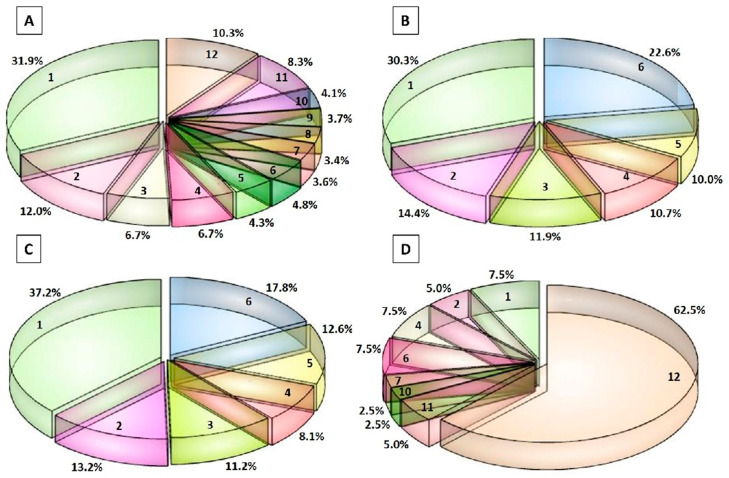
Figure 3.
Frequency of identification of the peptides in the Parmigiano-Reggiano (PR) peptide fractions. (A) Frequency of identification of the peptides considering all of the 12 PR samples. (B) Frequency of identification of the peptides in the 6 PR samples belonging to the high-salt and high-fat group. (C) Frequency of identification of the peptides in the 6 PR samples belonging to the low-salt and low-fat group. (D) Frequency of identification of the bioactive peptides considering all of the 12 PR samples. The numbers from 1 to 12 or from 1 to 6 indicate the number of PR samples in which the peptides were identified. The percentage values are referred to the % of peptides found in the PR samples. For example, in Figure 3A, 31.9% of single peptides were found in an individual PR sample, whereas the 10.3% of peptides were common in all of the 12 PR samples.

