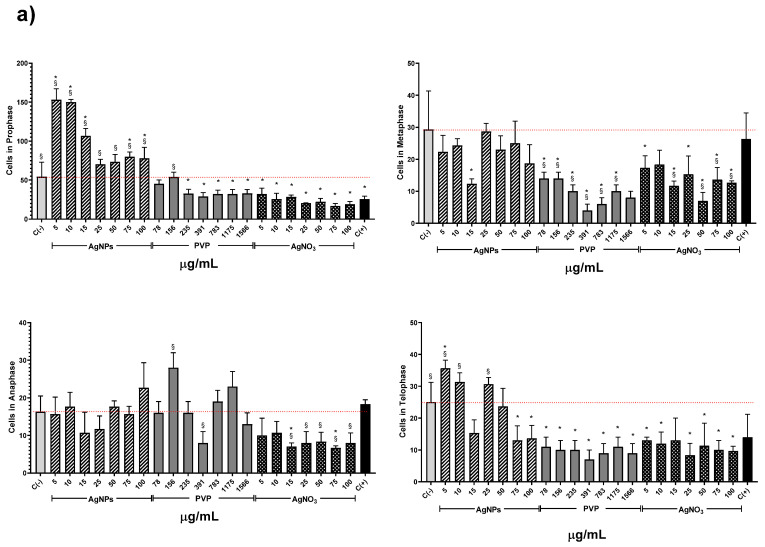
Figure 4.
Effects elicited by AgNPs, PVP, and AgNO3 on mitosis of Allium cepa root cells. (a) Cell population in each phase of mitosis after 72 h of exposure to several concentrations of AgNPs (lined), PVP (dark gray), and AgNO3 (grid). C- corresponds to untreated plants (light gray) and C+ to those exposed to 0.37 µg/mL of sodium arsenite (black). * Indicates significative differences with the negative control (p < 0.05); § indicates significative differences with the positive control (p < 0.05). (b) Representative photographs of cells at different stages of mitosis. Images were obtained with a digital camera adapted to the microscope using a 40× objective.


