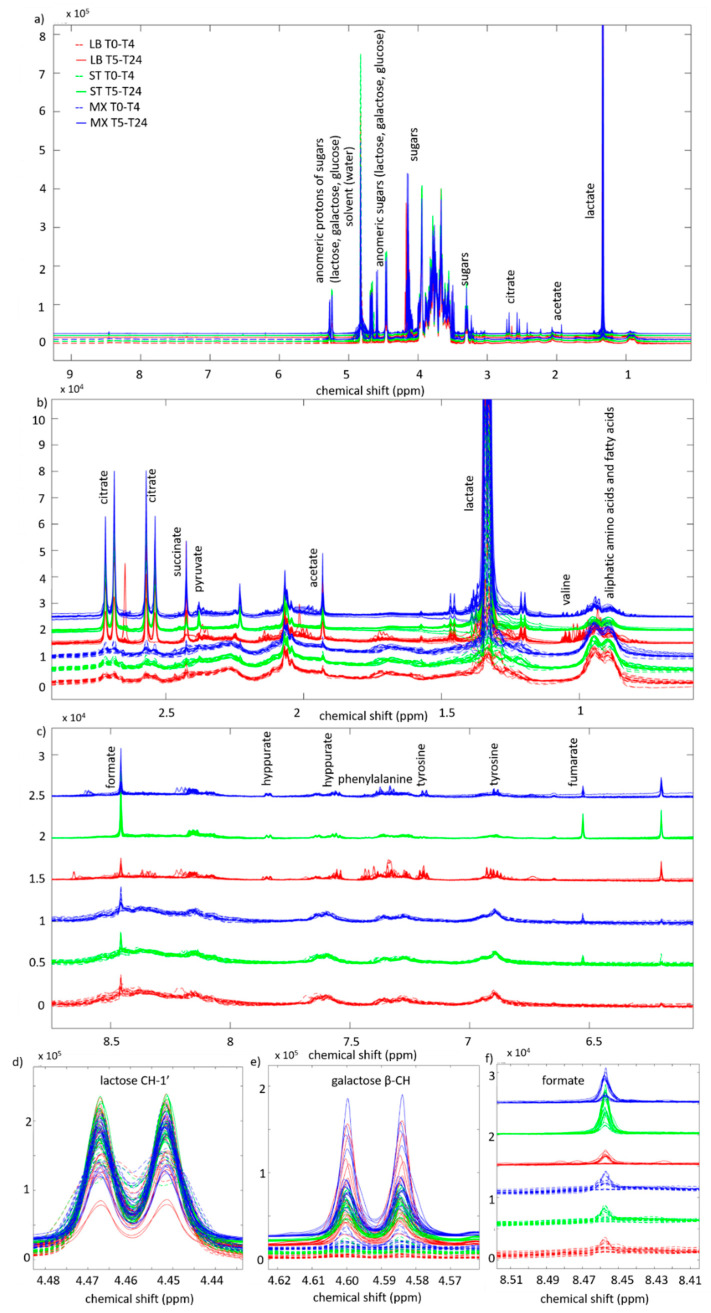
Figure 1.
(a) Pre-aligned normalized spectra for the first five time-points (T0–T4) and the last five (T5–24) represented respectively with dotted or full lines. Spectra are colored according to strain: LB in red, ST in green and MX in blue. (b) Zoomed-in aliphatic (0.6–3 ppm) and (c) aromatic (6–9 ppm) regions are also presented, together with some significant signals: lactose (4.44–4.48 ppm) (d), galactose (4.57–4.62 ppm) (e) and formate (8.41–8.51 ppm) (f). The six different spectral sets are represented with a small offset on the vertical axis to better visualize differences.

