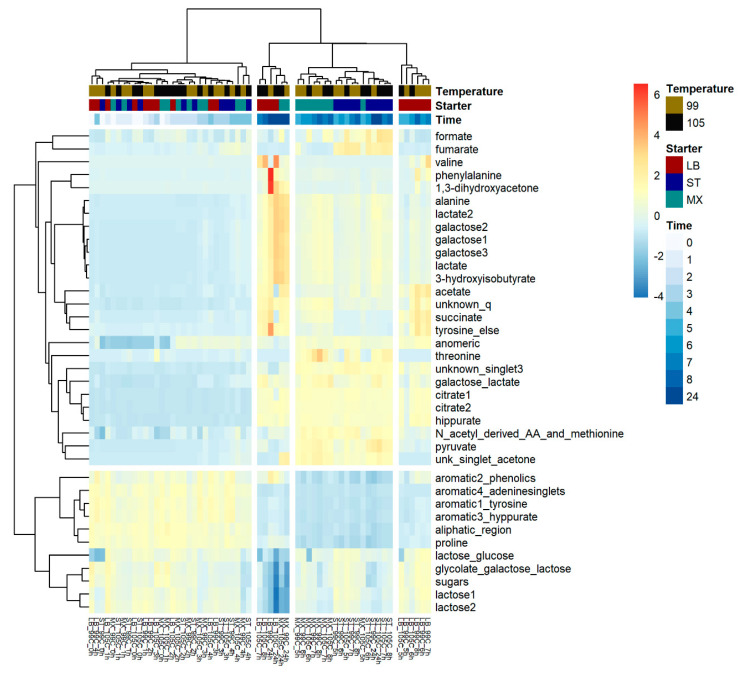
Figure 4.
Illustration of hierarchical heatmap clustering of the 37 selected intervals during the fermentation. The experimental design has been emphasized with color-coding. The relative concentration of metabolites is shown with a color gradient from blue (low) to red (high). Spacing in the heatmap shows the significant clusters found according to the gap statistic.

