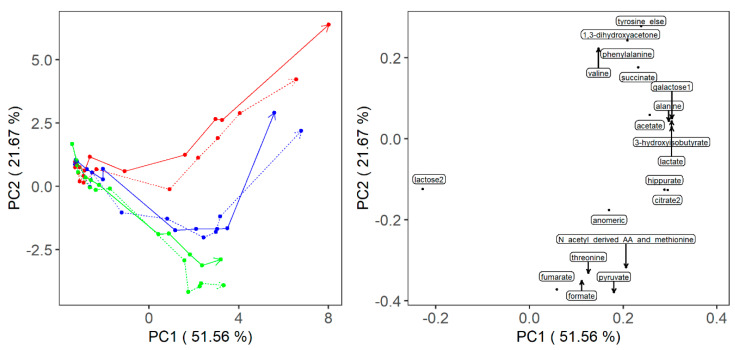
Figure A1.
Principal component analysis of 19 signals from known metabolites. Left: score plot with fermentation time denoted by trajectories. Starter cultures are colored as follows: L. delbrueckii ssp. bulgaricus red, S. thermophilus green and their combination in blue. LT milk is represented with a full line, while HT milk with a dotted line. Right: loading plot.

