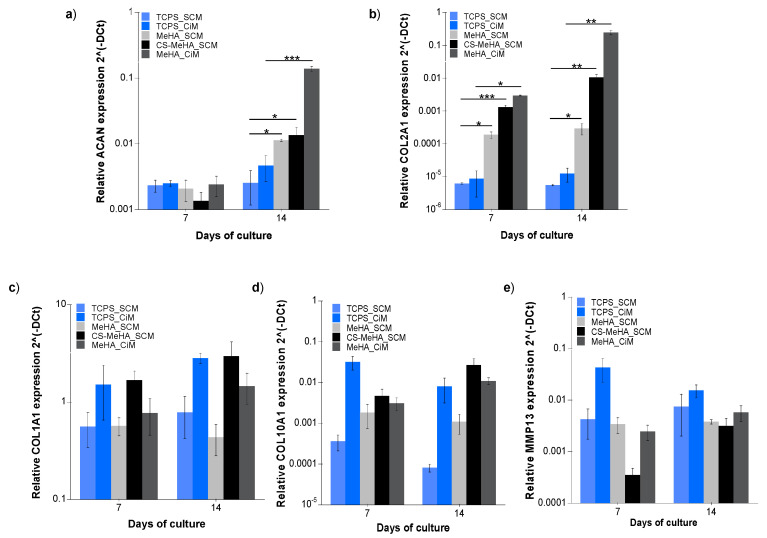
Figure 7.
Gene expression analysis of (a) ACAN, (b) Col2A1, (c) Col1A1, (d) Col10A1, and (e) MMP13 for hMSCs encapsulated in MeHA or CS-MeHA hydrogels, and for hMSCs cultured on tissue culture polystyrene (TCPS) (control) following 7 and 14 days of in vitro culture in SCM or CiM. The data were analyzed with one-way ANOVA and are presented as mean values ± standard error of the mean, * p < 0.05, ** p < 0.01, *** p < 0.001 (n = 3 for each donor, hMSCs derived from three different donors).

