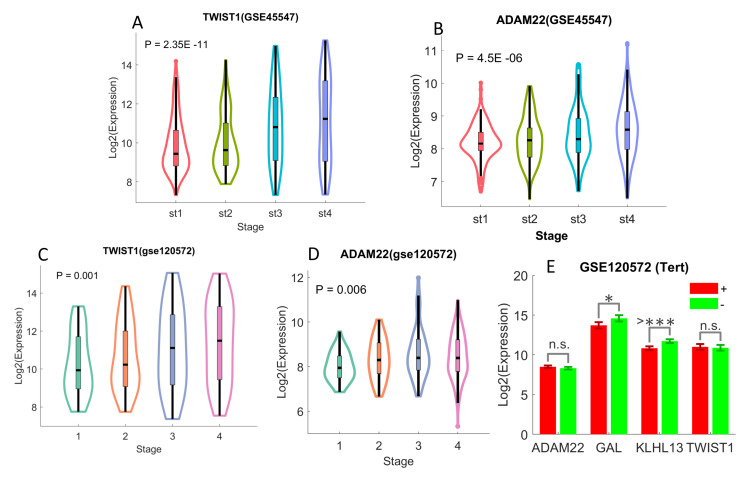
Figure 4.
The associations of UHR-NB genes with tumor stage and TERT rearrangement. The error bar in E denoted the mean expressions plus and minus one standard deviation. The raw p-values reported in (A–D) were estimated with the one-way ANOVA, while the p-values in E were calculated with the student’s t test. (A) TWIST1 and stage in GSE45547. (B) ADAM22 and tumor stage in GSE45547. (C) TWIST1 and tumor stage in GSE120572. (D) ADAM22 and stage in GSE120572. (E) UHR-NB genes and TERT.

