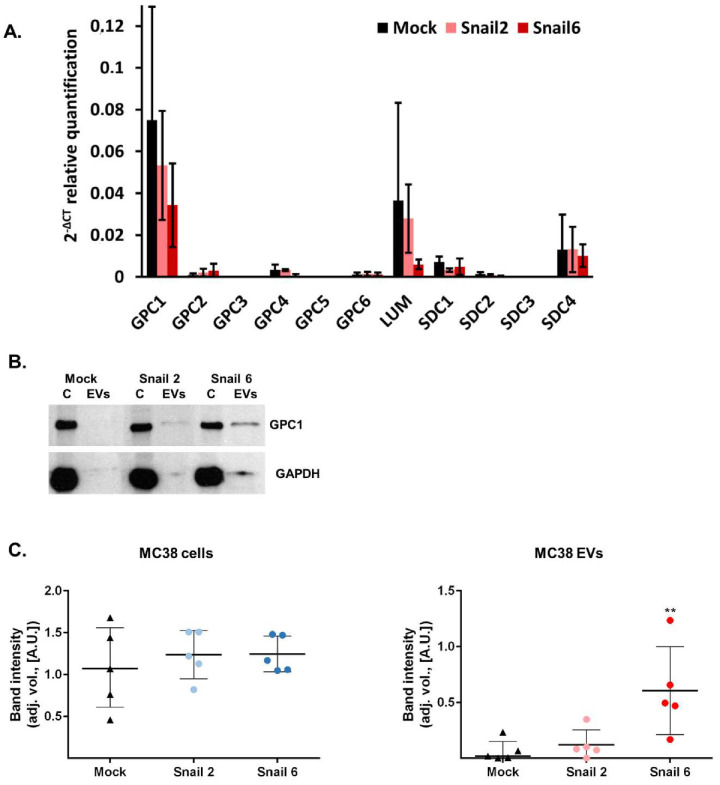
Figure 4.
Proteoglycans gene expression in EVs of Mock and Snail-overexpressing MC38 cells. (A) Real-time RT-PCR analysis of proteoglycans expression in Mock-MC38- and Snail-MC38-derived EVs; n ≥ 3. (B) Western blot analysis of Glypican-1 (GPC1) expression in cell lysates (C) from Mock- and Snail-MC38 cells and corresponding EVs. (C) Densitometry analysis of protein bands. For both MC38 cells and EVs: adjusted volume (adj. vol.) of GPC1 band was quantified by ImageLab® from Biorad (n = 4, ** p < 0.01).

