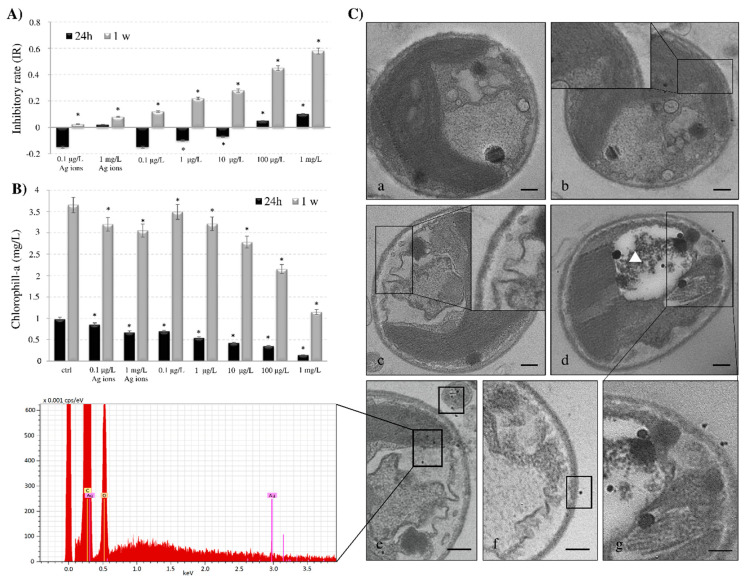
Figure 3.
(A) Analysis of inhibitory rate. Algae were incubated for 24 h and a week with Ag ions and with five concentrations of AgNPs-G. Data were analysed by performing one-way ANOVA at the 95% confidence level. Each value represents the mean ± SD of 3 technical replicates in each of the 3 independent experiments. Asterisks indicate significant differences from the control values (p < 0.05); (B) Analysis of chlorophyll-a content by spectrophotometric analysis of centrifuged samples. Quantitative determination was done according to Arnon et al. (1949). The experiments were conducted in triplicate and results are the mean with standard deviation. Asterisks indicate significant differences from the respective untreated samples (p < 0.05) (C) TEM micrographs of algal cells and elemental X-ray spectrum (lower panel) of the square area of micrograph (e) containing black spots. (a) control cell; (b) algal cells treated with Ag ions. (c) algal cells treated with AgNPs-G for 24 h. Plasma membrane detaches from the cell wall, as indicated in the magnification; (d–g) Algal cells treated with AgNPs-G for a week. AgNPs-G were observed inside large vacuoles (d, white triangle), inside algae (d–e) or crossing the cell wall (f–g). Bar = 500 nm.

