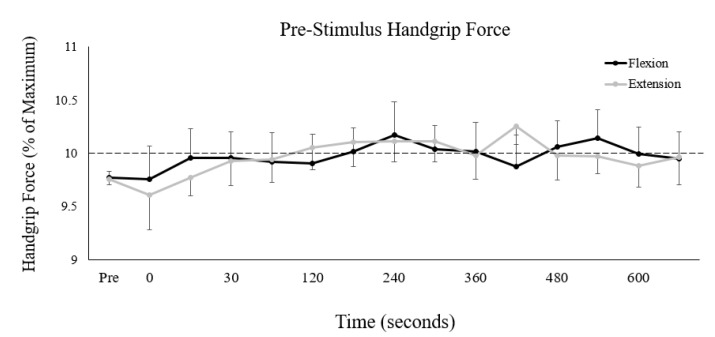
Figure 3.
Group averages of pre-stimulus (50 ms) handgrip force immediately prior to TMS. Black/grey lines represent pre-stimulus handgrip force during the flexion/extension fatigue sessions, respectively. The y-axis is scaled to the total target range allotted to participants (10 ± 1% of maximal handgrip force). The dashed horizontal line represents the 10% target participants were instructed to match. The x-axis displays time of measurement, with “pre” representing the non-fatigued baseline measures and “0” representing the first measurement immediately after the cessation of the fatigue-inducing trial. All unlabeled points occurred 15 s after the preceding time point. Error bars represent standard error.

