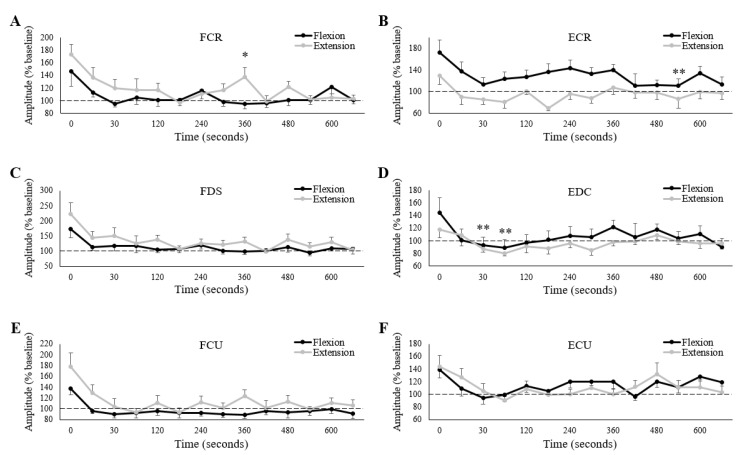
Figure 7.
Group averages of normalized (% of baseline) MEP amplitudes for (A) FCR, (B) ECR, (C) FDS, (D) EDC, (E) FCU and (F) ECU. Black/grey lines are muscle activity collected on the wrist flexion/extension fatigue sessions, respectively. Horizontal dashed lines represent baseline (pre-fatigue) values. The x-axes denote time, with “0” representing the first measurement immediately after the cessation of the fatigue-inducing trial. All unlabeled points occurred 15 s after the preceding time point. * denotes a significant difference between sessions at a single measurement point. ** denotes a significant difference of a single measurement point (across both sessions) to “0”. Error bars represent standard error.

