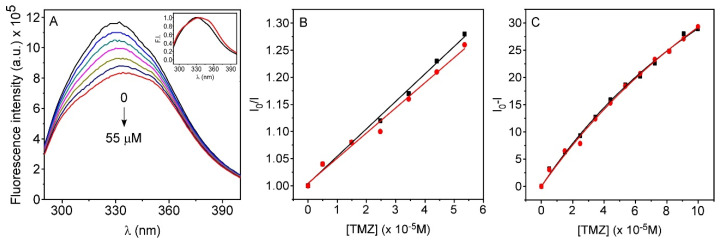
Figure 4.
(A) Fluorescent emission spectra of human serum albumin (has) (6.2 µM) (λexc = 280 nm) in water at 25 °C, and at increasing concentrations of TMZ. Inset: Normalized emission spectra of HSA in the absence (black) and the presence (red) of TMZ (55 µM). (B) Stern–Volmer plots for quenching of HSA by TMZ in water (black) and sodium phosphate buffer pH 7.4 (red). (C) Plot of ∆I = (I0-I) versus [TMZ] in water (black) and sodium phosphate buffer pH 7.4 (red).

