Figure 7.
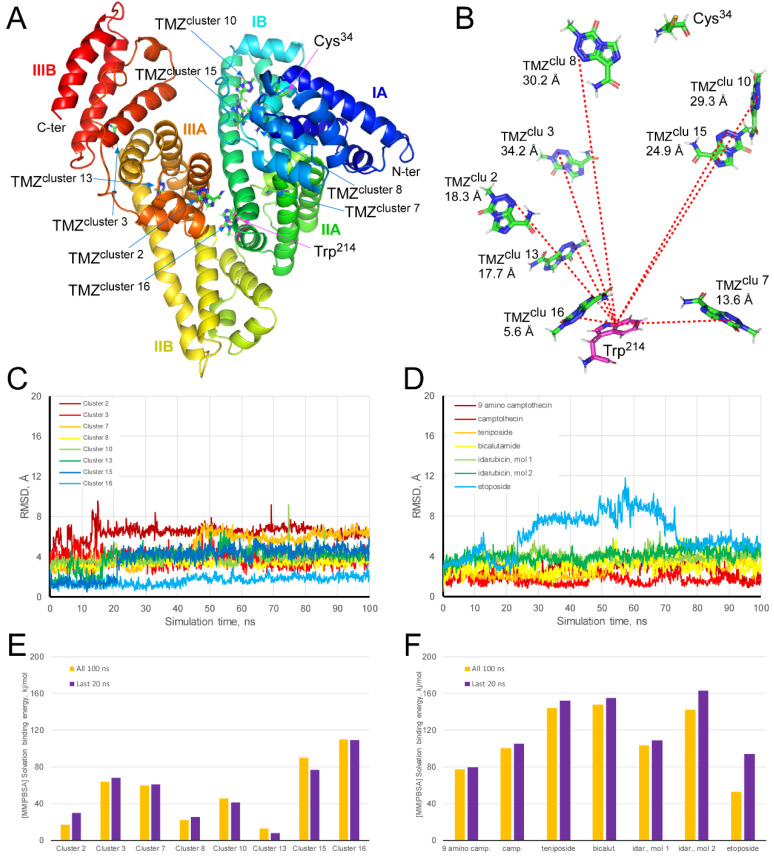
Molecular dynamics simulation of HSA-TMZ complex throughout 100 ns. (A) Secondary structure of HSA in rainbow color, from N-terminal (blue) to C-terminal (red). The three subdomains (I, II and III), as well as the amino acids Trp-214 and Cys-34, have been indicated. The docked TMZ molecule with the lowest Gibbs free energy of each cluster has been shown, indicating its location with blue arrows. (B) Distance (Å) between Trp-214 and the TMZ molecules of each cluster. (C,D) The trajectory (RMSD, Å) of TMZ molecules docked to HSA and different antineoplastic drugs bound to HSA, respectively. Molecular mechanics/Poisson–Boltzmann surface area solvation binding energy analysis of the HSA forming a complex with TMZ (E) and some antineoplastic (F), using YASARA dynamics v19.9.17 software. The best-docked complex, as the initial conformation for MD simulation, followed by 1000 snapshots (100 ns) obtained from the MD trajectory, were employed to calculate the values of solvation binding energy of TMZ or antineoplastic drugs. Additionally, the average value calculated for the last 200 snapshots (20 ns) is also displayed. YASARA-calculated binding energy provides positive values when the predicted binding is strong and stable whereas, negative values indicate no binding. Figure 7A,B were prepared using PyMol 2.3 software.

