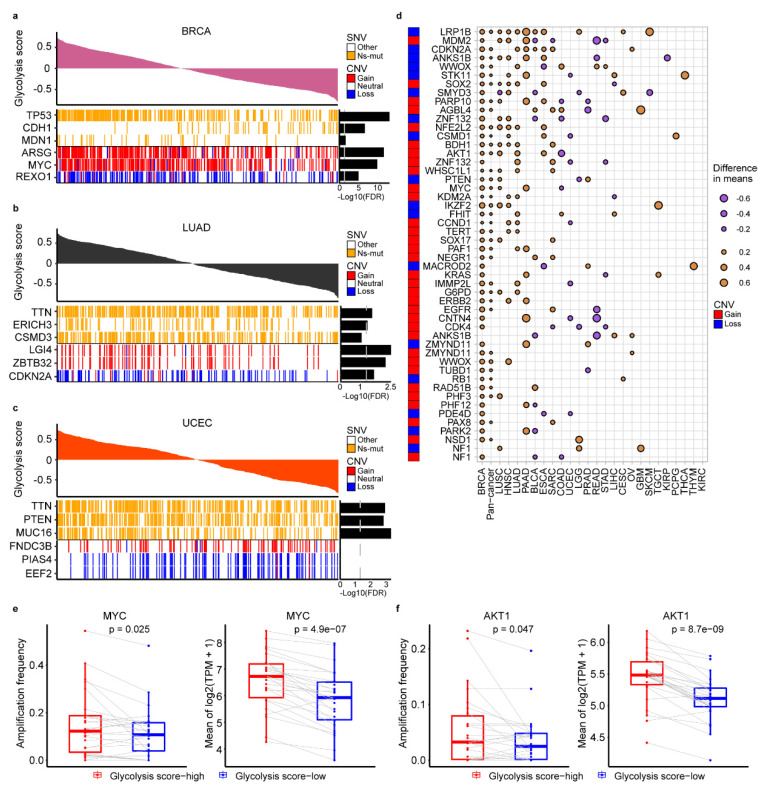
Figure 2.
Characteristics of genomic changes associated with glycolysis activity. (a–c). Notable associations of somatic single-nucleotide variants (SNVs) and copy number aberrations (CNAs) with tumor glycolysis in subjects with BRCA (a), LUAD (b) and UCEC (c). Benjamini and Hochberg adj.p values are on the right (T test). (d). Association of glycolysis with CNAs in oncogenes and tumor suppressor genes (T test). Dot size indicates the difference in mean glycolysis score between tumors with a CNA (gain for oncogene, loss for tumor suppressor gene) and those without a CNA. (e). Amplification frequency of MYC (left) and mean expression of MYC (right) is higher in glycolysis-high than low tumors across 25 cancer types. (f). Amplification frequency of AKT1 (left) and mean expression of AKT1 (right) is higher in glycolysis-high than low tumors across 25 cancer types. A paired Student’s t-test p < 0.05 is considered as a statistically significant difference.

